Reproduce results in Figure 3
Related dataset:
-
Due to the notable diffusion problem in Stereoseq, we disable the patch-effect to stablize the training:
no_patch_effect = True
Reference of mouse brain can be downloaded here
All the datasets are training with epoch settings: epochs = 400 seg_training_epochs = 15 deconv_warmup_epochs = 200
All the data for reproducing the result can be downloaded from Zenodo. The data used in this notebook is under the folder figure_3.
[ ]:
import os
# Download the data from the link above to this folder and unzip it, can be changed to your own path
os.chdir("/import/home3/yhchenmath/Dataset/CellARTPaper/figure_3/")
[2]:
import scanpy as sc
from matplotlib.gridspec import GridSpec
import matplotlib.pyplot as plt
from matplotlib.lines import Line2D
import pandas as pd
import spatialdata_plot
import numpy as np
/home/yhchenmath/anaconda3/envs/cellseg/lib/python3.9/site-packages/numba/core/decorators.py:282: RuntimeWarning: nopython is set for njit and is ignored
  warnings.warn('nopython is set for njit and is ignored', RuntimeWarning)
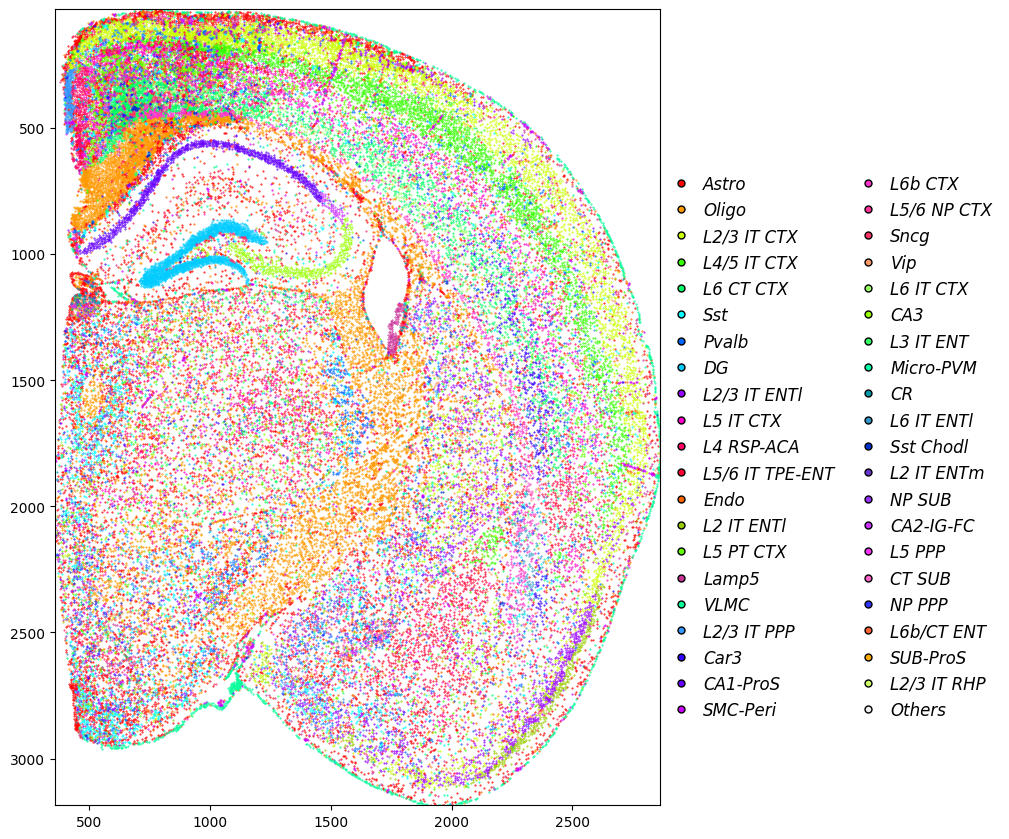
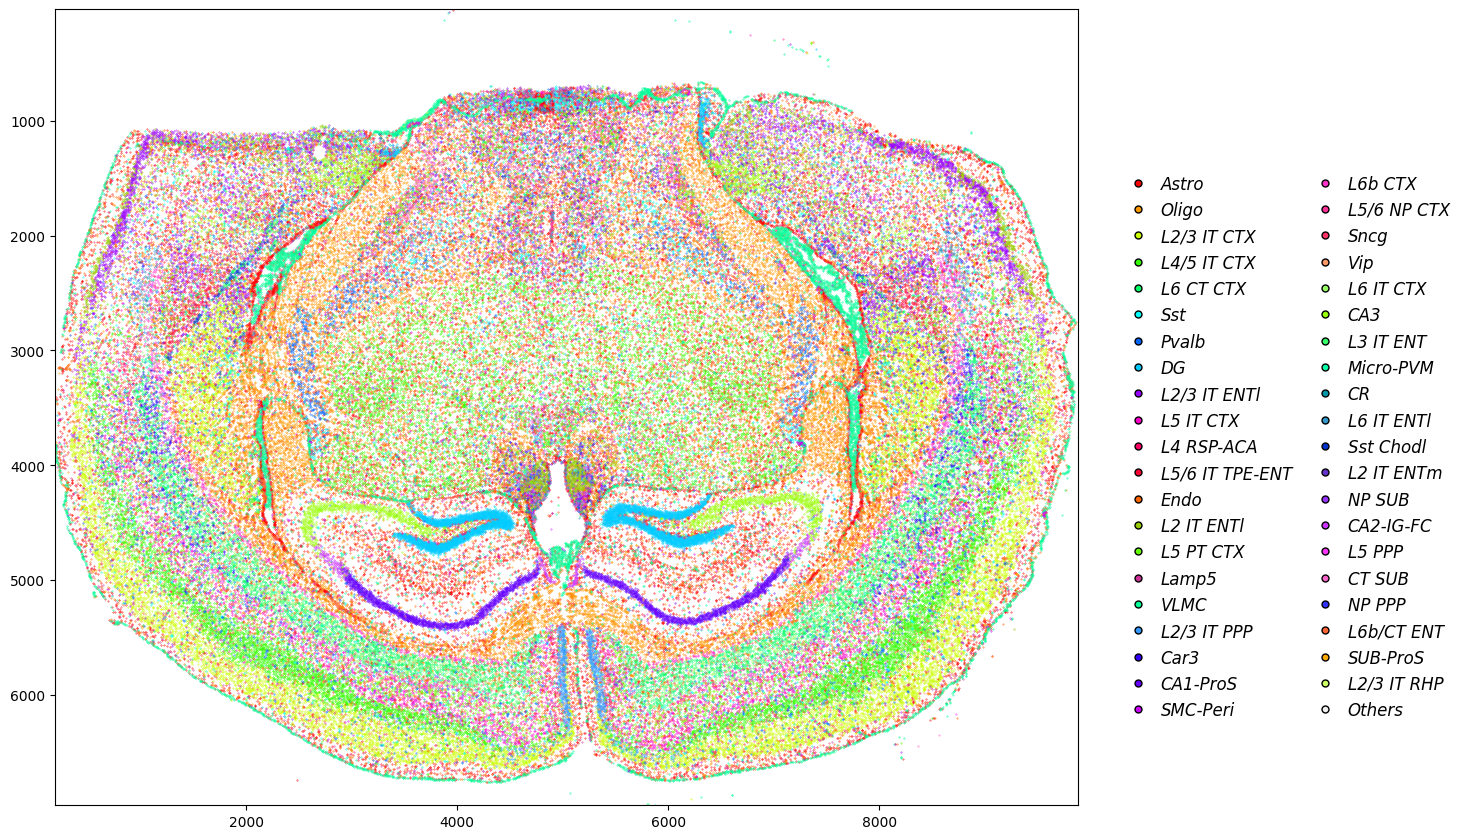
Comparison of Xenium and VisiumHD annotation
[3]:
adata_hd = sc.read_h5ad("hd_cell_deconv.h5ad")
adata_xenium = sc.read_h5ad("xenium_cell_deconv.h5ad")
[4]:
celltype_mapping = {
    'Astro': '#ff0000',
    'Oligo': '#ff9900',
    'L2/3 IT CTX': '#ccff00',
    'L4/5 IT CTX': '#33ff00',
    'L6 CT CTX': '#00ff66',
    'Sst': '#00ffff',
    'Pvalb': '#0066ff',
    'DG': '#00ccff',
    'L2/3 IT ENTl': '#9900ff',
    'L5 IT CTX': '#ff00cc',
    'L4 RSP-ACA': '#ff0066',
    'L5/6 IT TPE-ENT': '#ff0033',
    'Endo': '#ff6600',
    'L2 IT ENTl': '#99cc00',     # Changed from #ccff00
    'L5 PT CTX': '#66ff00',
    'Lamp5': '#cc3399',          # Changed from #ff0066
    'VLMC': '#00ff99',
    'L2/3 IT PPP': '#3399ff',    # Changed from #0066ff
    'Car3': '#3300ff',
    'CA1-ProS': '#6600ff',
    'SMC-Peri': '#cc00ff',
    'L6b CTX': '#ff33cc',        # Changed from #ff00cc
    'L5/6 NP CTX': '#ff3399',    # Changed from #ff0099
    'Sncg': '#ff3366',           # Changed from #ff0033
    'Vip': '#ff9966',            # Changed from #ff6600
    'L6 IT CTX': '#99ff66',      # Changed from #ccff00
    'CA3': '#99ff00',
    'L3 IT ENT': '#33ff66',      # Changed from #33ff00
    'Micro-PVM': '#00ffaa',      # Changed from #00ff99
    'CR': '#0099aa',             # Changed from #00ffff
    'L6 IT ENTl': '#3399cc',     # Changed from #0099ff
    'Sst Chodl': '#0033cc',      # Changed from #0033ff
    'L2 IT ENTm': '#6633cc',     # Changed from #6600ff
    'NP SUB': '#9933ff',         # Changed from #9900ff

    'CA2-IG-FC': '#cc33ff',      # Changed from #cc00ff
    'L5 PPP': '#ff33ff',         # Changed from #ff00ff
    'CT SUB': '#ff66cc',         # Changed from #ff0099
    'NP PPP': '#3333ff',         # Changed from #3300ff
    'L6b/CT ENT': '#ff6633',     # Changed from #ff3300
    'SUB-ProS': '#ffaa00',       # Changed from #ff9900
    'L2/3 IT RHP': '#ccff66',    # Changed from #ccff00

    'Others': '#F0F0F0'          # Grey, left unchanged
}

celltype_mapping_renamed = {
    k.replace(" ", "_").replace("/", "_").replace("-", "_"): k for k, _ in celltype_mapping.items()
}
[5]:
fig, ax = plt.subplots(1, 4, figsize=(10, 10))
gs = GridSpec(1, 4, figure=fig)

adata_plot = adata_hd.copy()
for ax_ in ax.flatten():
    fig.delaxes(ax_)

ax1 = fig.add_subplot(gs[0, :3])
ax2 = fig.add_subplot(gs[0, 3])

celltype_names = list(celltype_mapping.keys())[:-1]
# selected_celltype = ["Tumor II", "Tumor III", "Tumor V"]
selected_celltype = celltype_names
for i in range(len(celltype_names)):
    # (0,0) is on the top left corner
    if celltype_names[i] not in selected_celltype:
        continue
    sub_df = adata_plot[adata_plot.obs["celltype"] == celltype_names[i - 1]].obs
    ax1.scatter(sub_df["y"], sub_df["x"], s=0.2, label=celltype_names[i - 1], color=celltype_mapping[celltype_names[i - 1]])
# ax1.invert_yaxis()
# ax1.axis("off")
ax1.set_xlim(adata_plot.obs["y"].min(), adata_plot.obs["y"].max())
ax1.set_ylim(adata_plot.obs["x"].min(), adata_plot.obs["x"].max())
ax1.invert_yaxis()

# Add legend elements (example)
legend_elements = [
    Line2D(
        [0], [0],
        marker='o',
        linestyle='None',
        color='w',
        label=label,
        markerfacecolor=color,
        markeredgecolor='k',
        markersize=5
    ) for label, color in celltype_mapping.items()
]

ax2.legend(
    handles=legend_elements,
    loc='center',                    # Center the legend within the bounding box
    bbox_to_anchor=(0.48, 0.45),       # Center of ax2 (0.5, 0.5 is the middle of the axis)
    ncol=2,                          # Number of columns for the legend
    handletextpad=0.35,               # Spacing between marker and text
    columnspacing=1,               # Spacing between legend columns
    prop={'size': 12, 'style': 'italic'},  # Font size and style
    frameon=False                    # No border for the legend
)


ax2.axis("off")  # Hide the axis for ax2
# Adjust layout to prevent overlap
plt.tight_layout(rect=[0, 0.15, 1, 1])  # Leave space for the legend below the plots
[6]:
fig, ax = plt.subplots(1, 4, figsize=(15, 10))
gs = GridSpec(1, 4, figure=fig)

adata_plot = adata_xenium.copy()
for ax_ in ax.flatten():
    fig.delaxes(ax_)

ax1 = fig.add_subplot(gs[0, :3])
ax2 = fig.add_subplot(gs[0, 3])

celltype_names = list(celltype_mapping.keys())[:-1]
# selected_celltype = ["Tumor II", "Tumor III", "Tumor V"]
selected_celltype = celltype_names
for i in range(len(celltype_names)):
    # (0,0) is on the top left corner
    if celltype_names[i] not in selected_celltype:
        continue
    sub_df = adata_plot[adata_plot.obs["celltype"] == celltype_names[i - 1]].obs
    ax1.scatter(sub_df["y"], sub_df["x"], s=0.1, label=celltype_names[i - 1], color=celltype_mapping[celltype_names[i - 1]])
# ax1.invert_yaxis()
# ax1.axis("off")
ax1.set_xlim(adata_plot.obs["y"].min(), adata_plot.obs["y"].max())
ax1.set_ylim(adata_plot.obs["x"].min(), adata_plot.obs["x"].max())
ax1.invert_yaxis()

# Add legend elements (example)
legend_elements = [
    Line2D(
        [0], [0],
        marker='o',
        linestyle='None',
        color='w',
        label=label,
        markerfacecolor=color,
        markeredgecolor='k',
        markersize=5
    ) for label, color in celltype_mapping.items()
]

ax2.legend(
    handles=legend_elements,
    loc='center',                    # Center the legend within the bounding box
    bbox_to_anchor=(0.48, 0.45),       # Center of ax2 (0.5, 0.5 is the middle of the axis)
    ncol=2,                          # Number of columns for the legend
    handletextpad=0.35,               # Spacing between marker and text
    columnspacing=1,               # Spacing between legend columns
    prop={'size': 12, 'style': 'italic'},  # Font size and style
    frameon=False                    # No borderb for the legend
)


ax2.axis("off")  # Hide the axis for ax2
# Adjust layout to prevent overlap
plt.tight_layout(rect=[0, 0.15, 1, 1])  # Leave space for the legend below the plots
[7]:
import numpy as np
import seaborn as sns
import matplotlib.pyplot as plt
from matplotlib import rcParams

def plot_bar(df, x_col, y_col, hue, y_label, ax, method_colors, error_bar=False):
    # Plot
    if error_bar:
        sns.barplot(
            data=df,
            x=x_col,
            y=y_col,
            hue=hue,
            estimator=np.median,
            errorbar=('pi', 10),
            capsize=0.1,
            palette=method_colors,
            ax=ax,
            err_kws={"linewidth": 1}
        )
    else:
        sns.barplot(
            data=df,
            x=x_col,
            y=y_col,
            hue=hue,
            capsize=0.1,
            palette=method_colors,
            ax=ax,
            err_kws={"linewidth": 1}
        )

    # Axis labels and limits
    ax.set_ylabel(y_label, fontsize=15)
    ax.set_xlabel('')
    # ax.set(ylim=(0.18, 0.22))

    # Rotate x-tick labels
    ax.set_xticklabels(ax.get_xticklabels(), rotation=45, ha='right')

    # Remove grid
    ax.grid(False)

    # Customize spines (axis lines)
    ax.spines['left'].set_visible(True)
    ax.spines['bottom'].set_visible(True)
    ax.spines['left'].set_color('black')
    ax.spines['bottom'].set_color('black')
    ax.spines['left'].set_linewidth(1)
    ax.spines['bottom'].set_linewidth(1)
    ax.spines['right'].set_visible(False)
    ax.spines['top'].set_visible(False)

    # Add small outward ticks
    ax.tick_params(
        axis='both',
        which='major',
        direction='out',
        length=4,
        width=1,
        color='black',
        bottom=True, top=False, left=True, right=False
    )
[8]:
method_colors = {
    'VisiumHD': '#FF968D',  # Blue
    'Xenium': '#99DAFF',    # Orange
}
[9]:
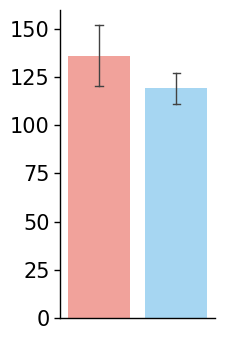
# Avg UMI for VisiumHD, Xenium, MERFISH
UMI_hd = adata_hd.X.sum(axis=1)
UMI_xenium = adata_xenium.X.sum(axis=1)

# Bar plot with error bars
df = pd.DataFrame({
    'Method': ['VisiumHD'] * len(UMI_hd) + ['Xenium'] * len(UMI_xenium),
    'Avg UMI': np.concatenate([UMI_hd, UMI_xenium])
})

fig, ax = plt.subplots(figsize=(2, 4))
plot_bar(
    df,
    x_col='Method',
    y_col='Avg UMI',
    hue='Method',
    y_label='Avg UMI',
    ax=ax,
    method_colors=method_colors,
    error_bar=True
)

ax.set_xlabel('')
ax.set_ylabel('')

ax.set_xticks([])
ax.tick_params(axis='y', labelsize=15)
/tmp/ipykernel_3535210/3461121328.py:39: UserWarning: FixedFormatter should only be used together with FixedLocator
  ax.set_xticklabels(ax.get_xticklabels(), rotation=45, ha='right')
[10]:
import torch
from tqdm.notebook import tqdm

mask_hd = np.load("./hd_segmentation_mask.npy")
mask_xenium = np.load("./xenium_segmentation_mask.npy")
mask_hd_torch = torch.from_numpy(mask_hd).cuda()
mask_xenium_torch = torch.from_numpy(mask_xenium).cuda()

# Get cell size for each modality
size_hd = []
for i in torch.unique(mask_hd_torch):
    if i == 0:
        continue
    size_hd.append((mask_hd_torch == i).sum().item())

size_xenium = []
for i in torch.unique(mask_xenium_torch):
    if i == 0:
        continue
    size_xenium.append((mask_xenium_torch == i).sum().item())
[11]:
# Plot cell size
df = pd.DataFrame({
    'Method': ['VisiumHD'] * len(size_hd) + ['Xenium'] * len(size_xenium), #  + ['MERFISH'] * len(size_merfish),
    'Cell Size': np.concatenate([[4*x for x in size_hd], size_xenium]) # , size_merfish])
})
fig, ax = plt.subplots(figsize=(2, 4))
plot_bar(
    df,
    x_col='Method',
    y_col='Cell Size',
    hue='Method',
    y_label='Cell Size',
    ax=ax,
    method_colors=method_colors,
    error_bar=True
)

ax.set_xlabel('')
ax.set_ylabel('')
ax.set_xticks([])
ax.tick_params(axis='y', labelsize=15)
/tmp/ipykernel_3535210/3461121328.py:39: UserWarning: FixedFormatter should only be used together with FixedLocator
  ax.set_xticklabels(ax.get_xticklabels(), rotation=45, ha='right')
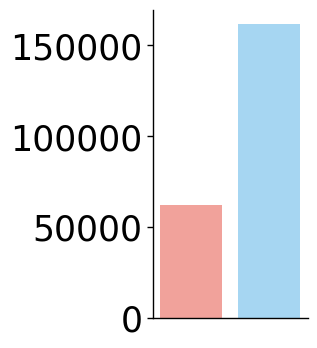
[12]:
df = pd.DataFrame({
    'Method': ['VisiumHD', 'Xenium'], # 'MERFISH'],
    'Cell Number': [adata_hd.shape[0], adata_xenium.shape[0]] #, adata_st_svt_merfish.shape[0]]
})
fig, ax = plt.subplots(figsize=(2, 4))
plot_bar(
    df,
    x_col='Method',
    y_col='Cell Number',
    hue='Method',
    y_label='Cell Number',
    ax=ax,
    method_colors=method_colors,
    error_bar=False
)

ax.set_xlabel('')
ax.set_ylabel('')
ax.set_xticks([])
ax.tick_params(axis='y', labelsize=25)
/tmp/ipykernel_3535210/3461121328.py:39: UserWarning: FixedFormatter should only be used together with FixedLocator
  ax.set_xticklabels(ax.get_xticklabels(), rotation=45, ha='right')
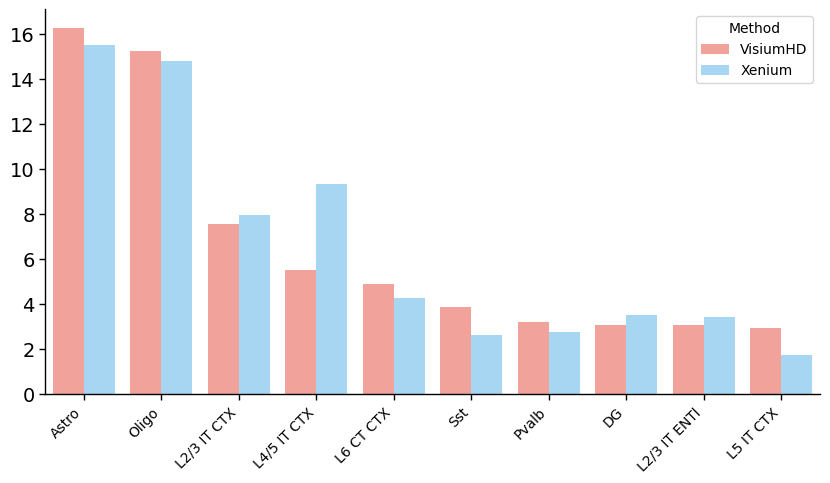
[13]:
# Celltype propotion
# Filtered out celltypes with less than 5%
celltype_counts = adata_hd.obs['celltype'].value_counts()
filtered_celltypes = celltype_counts[celltype_counts >= 0.01 * adata_hd.shape[0]].index.tolist()[:10]
# Find propotion in each modality
propotion_hd = adata_hd.obs['celltype'].value_counts(normalize=True)[filtered_celltypes]
propotion_xenium = adata_xenium.obs['celltype'].value_counts(normalize=True)[filtered_celltypes]
[14]:
# Plot bar plot for celltype propotion
df = pd.DataFrame({
    'Celltype': filtered_celltypes,
    'VisiumHD': propotion_hd.values,
    'Xenium': propotion_xenium.values,
    # 'MERFISH': propotion_merfish.values
})
df = df.melt(id_vars='Celltype', var_name='Method', value_name='Proportion')
# Propotion -> percentage
df['Proportion'] *= 100

fig, ax = plt.subplots(figsize=(10, 5))
plot_bar(
    df,
    x_col='Celltype',
    y_col='Proportion',
    hue='Method',
    y_label='Celltype Proportion',
    ax=ax,
    method_colors=method_colors,
    error_bar=False
)
# No legend
# ax.legend().remove()
# Save not show
# No x,y labels
# Save not show
# No x,y labels
# ax.set_xlabel('')
ax.set_ylabel('')
# ax.set_ylim(0.7, 0.85)
# No x tick
# ax.set_xticks([])
ax.tick_params(axis='y', labelsize=14)
/tmp/ipykernel_3535210/3461121328.py:39: UserWarning: FixedFormatter should only be used together with FixedLocator
  ax.set_xticklabels(ax.get_xticklabels(), rotation=45, ha='right')
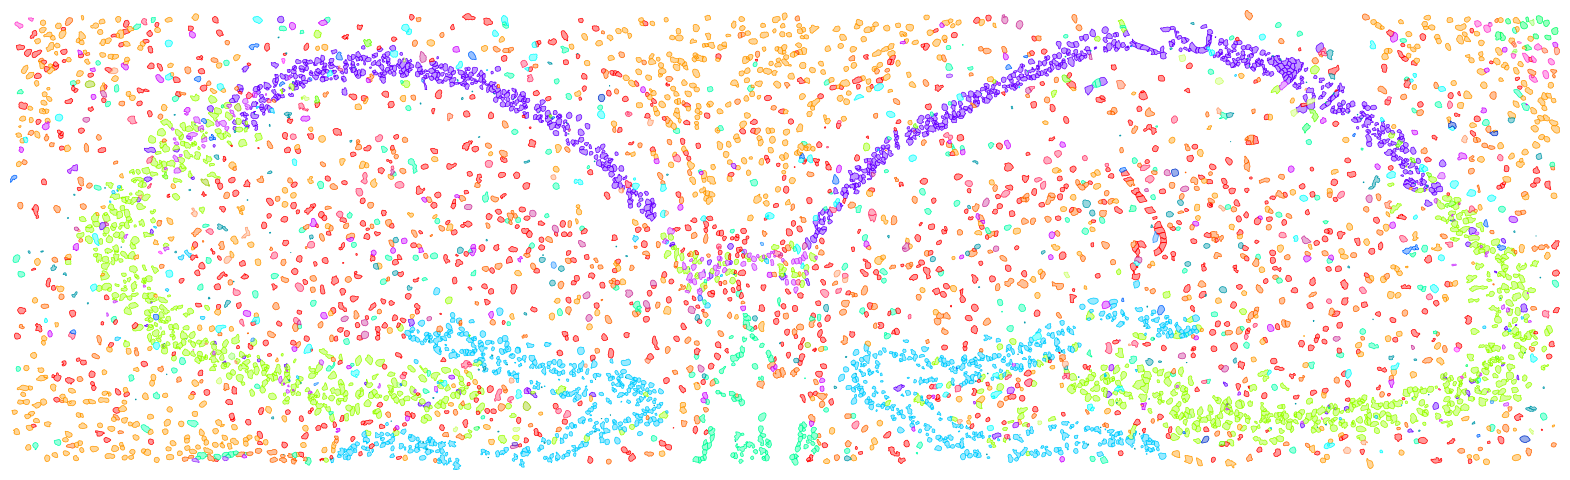
Hippocampus region comparison
[16]:
from cellart.utils.spatialdata_utils import append_xenium_boundary

adata_st_cellart = sc.read_h5ad("./hd_cell_deconv.h5ad")
adata_st_cellart_xenium = sc.read_h5ad("./xenium_cell_deconv.h5ad")
adata_st_cellart_merfish = sc.read_h5ad("./merfish_cell_deconv.h5ad")
adata_st_cellart_stereoseq = sc.read_h5ad("./stereoseq_cell_deconv.h5ad")

mask_hd = np.load("./hd_segmentation_mask.npy")
mask_xenium = np.load("./xenium_segmentation_mask.npy")
mask_merfish = np.load("./merfish_segmentation_mask.npy")
mask_stereoseq = np.load("./stereoseq_segmentation_mask.npy")


celltype_mapping = {
    'Astro': '#ff0000',
    'Oligo': '#ff9900',
    'L2/3 IT CTX': '#ccff00',
    'L4/5 IT CTX': '#33ff00',
    'L6 CT CTX': '#00ff66',
    'Sst': '#00ffff',
    'Pvalb': '#0066ff',
    'DG': '#00ccff',
    'L2/3 IT ENTl': '#9900ff',
    'L5 IT CTX': '#ff00cc',
    'L4 RSP-ACA': '#ff0066',
    'L5/6 IT TPE-ENT': '#ff0033',
    'Endo': '#ff6600',
    'L2 IT ENTl': '#99cc00',     # Changed from #ccff00
    'L5 PT CTX': '#66ff00',
    'Lamp5': '#cc3399',          # Changed from #ff0066
    'VLMC': '#00ff99',
    'L2/3 IT PPP': '#3399ff',    # Changed from #0066ff
    'Car3': '#3300ff',
    'CA1-ProS': '#6600ff',
    'SMC-Peri': '#cc00ff',
    'L6b CTX': '#ff33cc',        # Changed from #ff00cc
    'L5/6 NP CTX': '#ff3399',    # Changed from #ff0099
    'Sncg': '#ff3366',           # Changed from #ff0033
    'Vip': '#ff9966',            # Changed from #ff6600
    'L6 IT CTX': '#99ff66',      # Changed from #ccff00
    'CA3': '#99ff00',
    'L3 IT ENT': '#33ff66',      # Changed from #33ff00
    'Micro-PVM': '#00ffaa',      # Changed from #00ff99
    'CR': '#0099aa',             # Changed from #00ffff
    'L6 IT ENTl': '#3399cc',     # Changed from #0099ff
    'Sst Chodl': '#0033cc',      # Changed from #0033ff
    'L2 IT ENTm': '#6633cc',     # Changed from #6600ff
    'NP SUB': '#9933ff',         # Changed from #9900ff

    'CA2-IG-FC': '#cc33ff',      # Changed from #cc00ff
    'L5 PPP': '#ff33ff',         # Changed from #ff00ff
    'CT SUB': '#ff66cc',         # Changed from #ff0099
    'NP PPP': '#3333ff',         # Changed from #3300ff
    'L6b/CT ENT': '#ff6633',     # Changed from #ff3300
    'SUB-ProS': '#ffaa00',       # Changed from #ff9900
    'L2/3 IT RHP': '#ccff66',    # Changed from #ccff00

    'Others': '#F0F0F0'          # Grey, left unchanged
}

celltype_mapping_renamed = {
    k.replace(" ", "_").replace("/", "_").replace("-", "_"): v for k, v in celltype_mapping.items()
}

celltype_map = {
    k: k.replace(" ", "_").replace("/", "_").replace("-", "_") for k, _ in celltype_mapping.items()
}
[17]:
import spatialdata as sd
adata_temp = adata_st_cellart_merfish.copy()
gdf_merfish = append_xenium_boundary(mask_merfish, None, None, celltype = adata_temp.obs["celltype"])
boundaries = sd.models.ShapesModel.parse(gdf_merfish)
# img = sd.models.Image2DModel.parse(dapi, dims=("c", "y", "x"))
sdata_merfish = sd.SpatialData()
sdata_merfish.shapes["cell_boundaries"] = boundaries
# sdata_merfish.images["dapi"] = img

# Vizgen boundary
adata_temp = sc.read_h5ad("vizgen_scvi.h5ad")
mask_vizgen = np.load("cell_vizgen_mask.npy")
gdf_vizgen = append_xenium_boundary(mask_vizgen, None, None, celltype = adata_temp.obs["C_scANVI"])
boundaries = sd.models.ShapesModel.parse(gdf_vizgen)
sdata_merfish.shapes["vizgen_boundaries"] = boundaries

import math

theta =  - math.pi / 14
rotation = sd.transformations.Affine(
    [
        [math.cos(theta), -math.sin(theta), 0],
        [math.sin(theta), math.cos(theta), 0],
        [0, 0, 1],
    ],
    input_axes=("x", "y"),
    output_axes=("x", "y"),
)

# sd.transformations.set_transformation(sdata_merfish.images["dapi"], rotation, to_coordinate_system="global")
sd.transformations.set_transformation(sdata_merfish.shapes["cell_boundaries"], rotation, to_coordinate_system="global")
sd.transformations.set_transformation(sdata_merfish.shapes["vizgen_boundaries"], rotation, to_coordinate_system="global")

x_min, x_max, y_min, y_max = 800, 1800, 4000, 7500
sdata_roi = sdata_merfish.query.bounding_box(
    min_coordinate=[x_min, y_min], max_coordinate=[x_max, y_max], axes=("y", "x"), target_coordinate_system="global"
)

ct_col = sdata_roi.shapes["cell_boundaries"].celltype
cts = sdata_roi.shapes["cell_boundaries"].celltype.unique()
for ct in cts:
    sdata_roi.shapes[f"cell_boundaries_{ct.replace(' ', '_').replace('/', '_').replace('-', '_')}"] = sdata_roi.shapes["cell_boundaries"][ct_col == ct]

ct_col = sdata_roi.shapes["vizgen_boundaries"].celltype
cts = sdata_roi.shapes["vizgen_boundaries"].celltype.unique()
for ct in cts:
    sdata_roi.shapes[f"vizgen_boundaries_{ct.replace(' ', '_').replace('/', '_').replace('-', '_')}"] = sdata_roi.shapes["vizgen_boundaries"][ct_col == ct]
Not sdata provided
Not sdata provided
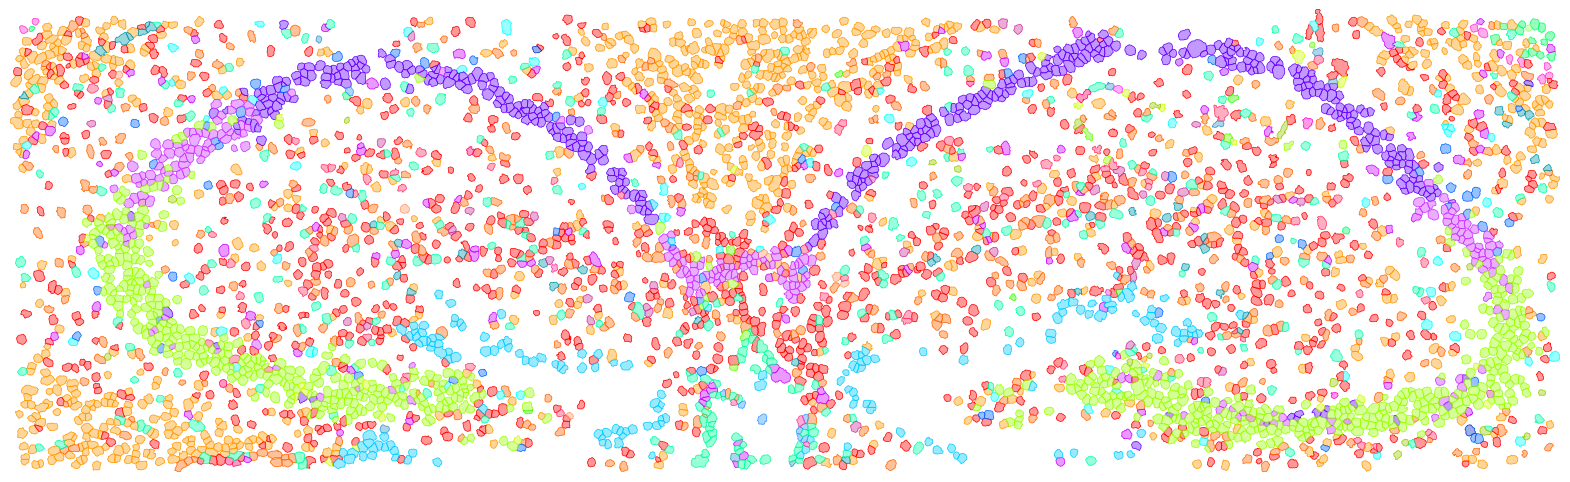
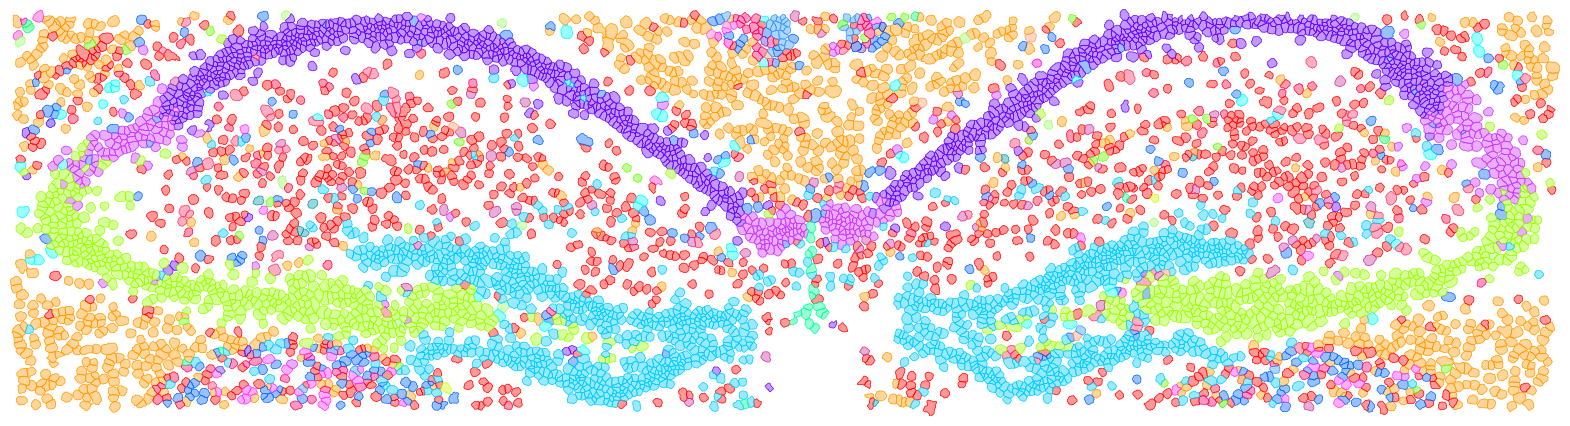
[18]:
ct_col = sdata_roi.shapes["cell_boundaries"].celltype
cts = sdata_roi.shapes["cell_boundaries"].celltype.unique()
for ct in cts:
    sdata_roi.shapes[f"cell_boundaries_{ct.replace(' ', '_').replace('/', '_').replace('-', '_')}"] = sdata_roi.shapes["cell_boundaries"][ct_col == ct]

ct_col = sdata_roi.shapes["vizgen_boundaries"].celltype
cts = sdata_roi.shapes["vizgen_boundaries"].celltype.unique()
for ct in cts:
    sdata_roi.shapes[f"vizgen_boundaries_{ct.replace(' ', '_').replace('/', '_').replace('-', '_')}"] = sdata_roi.shapes["vizgen_boundaries"][ct_col == ct]


import matplotlib.pyplot as plt
fig, ax = plt.subplots(1, 1, figsize=(20, 10))

tmp = None
draw_cts = sdata_roi.shapes["vizgen_boundaries"].celltype.unique().tolist()
for ct in draw_cts:
    color = celltype_mapping_renamed[ct.replace(' ', '_').replace('/', '_').replace('-', '_')]
    if tmp is None:
        tmp = sdata_roi.pl.render_shapes(
        f"vizgen_boundaries_{ct.replace(' ', '_').replace('/', '_').replace('-', '_')}",
        color=color, fill_alpha=0.4, outline_width=0.5, outline_color = color, outline_alpha=1
    )
    else:
        tmp = tmp.pl.render_shapes(
        f"vizgen_boundaries_{ct.replace(' ', '_').replace('/', '_').replace('-', '_')}",
        color=color, fill_alpha=0.4, outline_width=0.5, outline_color = color, outline_alpha=1
    )
tmp.pl.show(coordinate_systems="global", title="", frameon=False, legend_loc='none', return_ax=True, ax=ax)
ax.axis("off")

import matplotlib.pyplot as plt
fig, ax = plt.subplots(1, 1, figsize=(20, 10))

tmp = None
draw_cts = sdata_roi.shapes["cell_boundaries"].celltype.unique().tolist()
for ct in draw_cts:
    color = celltype_mapping_renamed[ct.replace(' ', '_').replace('/', '_').replace('-', '_')]
    if tmp is None:
        tmp = sdata_roi.pl.render_shapes(
        f"cell_boundaries_{ct.replace(' ', '_').replace('/', '_').replace('-', '_')}",
        color=color, fill_alpha=0.4, outline_width=0.5, outline_color = color, outline_alpha=1
    )
    else:
        tmp = tmp.pl.render_shapes(
        f"cell_boundaries_{ct.replace(' ', '_').replace('/', '_').replace('-', '_')}",
        color=color, fill_alpha=0.4, outline_width=0.5, outline_color = color, outline_alpha=1
    )
tmp.pl.show(coordinate_systems="global", title="", frameon=False, legend_loc='none', return_ax=True, ax=ax)
ax.axis("off")
INFO     Value for parameter 'color' appears to be a color, using it as such.
INFO     Value for parameter 'color' appears to be a color, using it as such.
INFO     Value for parameter 'color' appears to be a color, using it as such.
INFO     Value for parameter 'color' appears to be a color, using it as such.
INFO     Value for parameter 'color' appears to be a color, using it as such.
INFO     Value for parameter 'color' appears to be a color, using it as such.
INFO     Value for parameter 'color' appears to be a color, using it as such.
INFO     Value for parameter 'color' appears to be a color, using it as such.
INFO     Value for parameter 'color' appears to be a color, using it as such.
INFO     Value for parameter 'color' appears to be a color, using it as such.
INFO     Value for parameter 'color' appears to be a color, using it as such.
INFO     Value for parameter 'color' appears to be a color, using it as such.
INFO     Value for parameter 'color' appears to be a color, using it as such.
INFO     Value for parameter 'color' appears to be a color, using it as such.
INFO     Value for parameter 'color' appears to be a color, using it as such.
INFO     Value for parameter 'color' appears to be a color, using it as such.
INFO     Value for parameter 'color' appears to be a color, using it as such.
INFO     Value for parameter 'color' appears to be a color, using it as such.
/home/yhchenmath/anaconda3/envs/cellseg/lib/python3.9/site-packages/spatialdata/_core/_elements.py:96: UserWarning: Key `cell_boundaries_L6b_CTX` already exists. Overwriting it in-memory.
  self._check_key(key, self.keys(), self._shared_keys)
/home/yhchenmath/anaconda3/envs/cellseg/lib/python3.9/site-packages/spatialdata/_core/_elements.py:96: UserWarning: Key `cell_boundaries_L6_CT_CTX` already exists. Overwriting it in-memory.
  self._check_key(key, self.keys(), self._shared_keys)
/home/yhchenmath/anaconda3/envs/cellseg/lib/python3.9/site-packages/spatialdata/_core/_elements.py:96: UserWarning: Key `cell_boundaries_Oligo` already exists. Overwriting it in-memory.
  self._check_key(key, self.keys(), self._shared_keys)
/home/yhchenmath/anaconda3/envs/cellseg/lib/python3.9/site-packages/spatialdata/_core/_elements.py:96: UserWarning: Key `cell_boundaries_Astro` already exists. Overwriting it in-memory.
  self._check_key(key, self.keys(), self._shared_keys)
/home/yhchenmath/anaconda3/envs/cellseg/lib/python3.9/site-packages/spatialdata/_core/_elements.py:96: UserWarning: Key `cell_boundaries_Endo` already exists. Overwriting it in-memory.
  self._check_key(key, self.keys(), self._shared_keys)
/home/yhchenmath/anaconda3/envs/cellseg/lib/python3.9/site-packages/spatialdata/_core/_elements.py:96: UserWarning: Key `cell_boundaries_CR` already exists. Overwriting it in-memory.
  self._check_key(key, self.keys(), self._shared_keys)
/home/yhchenmath/anaconda3/envs/cellseg/lib/python3.9/site-packages/spatialdata/_core/_elements.py:96: UserWarning: Key `cell_boundaries_Micro_PVM` already exists. Overwriting it in-memory.
  self._check_key(key, self.keys(), self._shared_keys)
/home/yhchenmath/anaconda3/envs/cellseg/lib/python3.9/site-packages/spatialdata/_core/_elements.py:96: UserWarning: Key `cell_boundaries_SMC_Peri` already exists. Overwriting it in-memory.
  self._check_key(key, self.keys(), self._shared_keys)
/home/yhchenmath/anaconda3/envs/cellseg/lib/python3.9/site-packages/spatialdata/_core/_elements.py:96: UserWarning: Key `cell_boundaries_Sst` already exists. Overwriting it in-memory.
  self._check_key(key, self.keys(), self._shared_keys)
/home/yhchenmath/anaconda3/envs/cellseg/lib/python3.9/site-packages/spatialdata/_core/_elements.py:96: UserWarning: Key `cell_boundaries_CA1_ProS` already exists. Overwriting it in-memory.
  self._check_key(key, self.keys(), self._shared_keys)
/home/yhchenmath/anaconda3/envs/cellseg/lib/python3.9/site-packages/spatialdata/_core/_elements.py:96: UserWarning: Key `cell_boundaries_Vip` already exists. Overwriting it in-memory.
  self._check_key(key, self.keys(), self._shared_keys)
/home/yhchenmath/anaconda3/envs/cellseg/lib/python3.9/site-packages/spatialdata/_core/_elements.py:96: UserWarning: Key `cell_boundaries_Sncg` already exists. Overwriting it in-memory.
  self._check_key(key, self.keys(), self._shared_keys)
/home/yhchenmath/anaconda3/envs/cellseg/lib/python3.9/site-packages/spatialdata/_core/_elements.py:96: UserWarning: Key `cell_boundaries_L6_IT_ENTl` already exists. Overwriting it in-memory.
  self._check_key(key, self.keys(), self._shared_keys)
/home/yhchenmath/anaconda3/envs/cellseg/lib/python3.9/site-packages/spatialdata/_core/_elements.py:96: UserWarning: Key `cell_boundaries_Lamp5` already exists. Overwriting it in-memory.
  self._check_key(key, self.keys(), self._shared_keys)
/home/yhchenmath/anaconda3/envs/cellseg/lib/python3.9/site-packages/spatialdata/_core/_elements.py:96: UserWarning: Key `cell_boundaries_Pvalb` already exists. Overwriting it in-memory.
  self._check_key(key, self.keys(), self._shared_keys)
/home/yhchenmath/anaconda3/envs/cellseg/lib/python3.9/site-packages/spatialdata/_core/_elements.py:96: UserWarning: Key `cell_boundaries_CA2_IG_FC` already exists. Overwriting it in-memory.
  self._check_key(key, self.keys(), self._shared_keys)
/home/yhchenmath/anaconda3/envs/cellseg/lib/python3.9/site-packages/spatialdata/_core/_elements.py:96: UserWarning: Key `cell_boundaries_CA3` already exists. Overwriting it in-memory.
  self._check_key(key, self.keys(), self._shared_keys)
/home/yhchenmath/anaconda3/envs/cellseg/lib/python3.9/site-packages/spatialdata/_core/_elements.py:96: UserWarning: Key `cell_boundaries_L2_3_IT_PPP` already exists. Overwriting it in-memory.
  self._check_key(key, self.keys(), self._shared_keys)
/home/yhchenmath/anaconda3/envs/cellseg/lib/python3.9/site-packages/spatialdata/_core/_elements.py:96: UserWarning: Key `cell_boundaries_Sst_Chodl` already exists. Overwriting it in-memory.
  self._check_key(key, self.keys(), self._shared_keys)
/home/yhchenmath/anaconda3/envs/cellseg/lib/python3.9/site-packages/spatialdata/_core/_elements.py:96: UserWarning: Key `cell_boundaries_L2_3_IT_CTX` already exists. Overwriting it in-memory.
  self._check_key(key, self.keys(), self._shared_keys)
/home/yhchenmath/anaconda3/envs/cellseg/lib/python3.9/site-packages/spatialdata/_core/_elements.py:96: UserWarning: Key `cell_boundaries_L2_IT_ENTl` already exists. Overwriting it in-memory.
  self._check_key(key, self.keys(), self._shared_keys)
/home/yhchenmath/anaconda3/envs/cellseg/lib/python3.9/site-packages/spatialdata/_core/_elements.py:96: UserWarning: Key `cell_boundaries_L4_RSP_ACA` already exists. Overwriting it in-memory.
  self._check_key(key, self.keys(), self._shared_keys)
/home/yhchenmath/anaconda3/envs/cellseg/lib/python3.9/site-packages/spatialdata/_core/_elements.py:96: UserWarning: Key `cell_boundaries_L4_5_IT_CTX` already exists. Overwriting it in-memory.
  self._check_key(key, self.keys(), self._shared_keys)
/home/yhchenmath/anaconda3/envs/cellseg/lib/python3.9/site-packages/spatialdata/_core/_elements.py:96: UserWarning: Key `cell_boundaries_L2_3_IT_ENTl` already exists. Overwriting it in-memory.
  self._check_key(key, self.keys(), self._shared_keys)
/home/yhchenmath/anaconda3/envs/cellseg/lib/python3.9/site-packages/spatialdata/_core/_elements.py:96: UserWarning: Key `cell_boundaries_L5_PPP` already exists. Overwriting it in-memory.
  self._check_key(key, self.keys(), self._shared_keys)
/home/yhchenmath/anaconda3/envs/cellseg/lib/python3.9/site-packages/spatialdata/_core/_elements.py:96: UserWarning: Key `cell_boundaries_L5_PT_CTX` already exists. Overwriting it in-memory.
  self._check_key(key, self.keys(), self._shared_keys)
/home/yhchenmath/anaconda3/envs/cellseg/lib/python3.9/site-packages/spatialdata/_core/_elements.py:96: UserWarning: Key `cell_boundaries_L5_6_IT_TPE_ENT` already exists. Overwriting it in-memory.
  self._check_key(key, self.keys(), self._shared_keys)
/home/yhchenmath/anaconda3/envs/cellseg/lib/python3.9/site-packages/spatialdata/_core/_elements.py:96: UserWarning: Key `cell_boundaries_DG` already exists. Overwriting it in-memory.
  self._check_key(key, self.keys(), self._shared_keys)
/home/yhchenmath/anaconda3/envs/cellseg/lib/python3.9/site-packages/spatialdata/_core/_elements.py:96: UserWarning: Key `cell_boundaries_L6_IT_CTX` already exists. Overwriting it in-memory.
  self._check_key(key, self.keys(), self._shared_keys)
/home/yhchenmath/anaconda3/envs/cellseg/lib/python3.9/site-packages/spatialdata/_core/_elements.py:96: UserWarning: Key `cell_boundaries_L5_6_NP_CTX` already exists. Overwriting it in-memory.
  self._check_key(key, self.keys(), self._shared_keys)
/home/yhchenmath/anaconda3/envs/cellseg/lib/python3.9/site-packages/spatialdata/_core/_elements.py:96: UserWarning: Key `cell_boundaries_L5_IT_CTX` already exists. Overwriting it in-memory.
  self._check_key(key, self.keys(), self._shared_keys)
/home/yhchenmath/anaconda3/envs/cellseg/lib/python3.9/site-packages/spatialdata/_core/_elements.py:96: UserWarning: Key `cell_boundaries_Car3` already exists. Overwriting it in-memory.
  self._check_key(key, self.keys(), self._shared_keys)
/home/yhchenmath/anaconda3/envs/cellseg/lib/python3.9/site-packages/spatialdata/_core/_elements.py:96: UserWarning: Key `cell_boundaries_VLMC` already exists. Overwriting it in-memory.
  self._check_key(key, self.keys(), self._shared_keys)
/home/yhchenmath/anaconda3/envs/cellseg/lib/python3.9/site-packages/spatialdata/_core/_elements.py:96: UserWarning: Key `vizgen_boundaries_CA1_ProS` already exists. Overwriting it in-memory.
  self._check_key(key, self.keys(), self._shared_keys)
/home/yhchenmath/anaconda3/envs/cellseg/lib/python3.9/site-packages/spatialdata/_core/_elements.py:96: UserWarning: Key `vizgen_boundaries_CA3` already exists. Overwriting it in-memory.
  self._check_key(key, self.keys(), self._shared_keys)
/home/yhchenmath/anaconda3/envs/cellseg/lib/python3.9/site-packages/spatialdata/_core/_elements.py:96: UserWarning: Key `vizgen_boundaries_Micro_PVM` already exists. Overwriting it in-memory.
  self._check_key(key, self.keys(), self._shared_keys)
/home/yhchenmath/anaconda3/envs/cellseg/lib/python3.9/site-packages/spatialdata/_core/_elements.py:96: UserWarning: Key `vizgen_boundaries_DG` already exists. Overwriting it in-memory.
  self._check_key(key, self.keys(), self._shared_keys)
/home/yhchenmath/anaconda3/envs/cellseg/lib/python3.9/site-packages/spatialdata/_core/_elements.py:96: UserWarning: Key `vizgen_boundaries_Astro` already exists. Overwriting it in-memory.
  self._check_key(key, self.keys(), self._shared_keys)
/home/yhchenmath/anaconda3/envs/cellseg/lib/python3.9/site-packages/spatialdata/_core/_elements.py:96: UserWarning: Key `vizgen_boundaries_Endo` already exists. Overwriting it in-memory.
  self._check_key(key, self.keys(), self._shared_keys)
/home/yhchenmath/anaconda3/envs/cellseg/lib/python3.9/site-packages/spatialdata/_core/_elements.py:96: UserWarning: Key `vizgen_boundaries_Oligo` already exists. Overwriting it in-memory.
  self._check_key(key, self.keys(), self._shared_keys)
/home/yhchenmath/anaconda3/envs/cellseg/lib/python3.9/site-packages/spatialdata/_core/_elements.py:96: UserWarning: Key `vizgen_boundaries_Sncg` already exists. Overwriting it in-memory.
  self._check_key(key, self.keys(), self._shared_keys)
/home/yhchenmath/anaconda3/envs/cellseg/lib/python3.9/site-packages/spatialdata/_core/_elements.py:96: UserWarning: Key `vizgen_boundaries_CR` already exists. Overwriting it in-memory.
  self._check_key(key, self.keys(), self._shared_keys)
/home/yhchenmath/anaconda3/envs/cellseg/lib/python3.9/site-packages/spatialdata/_core/_elements.py:96: UserWarning: Key `vizgen_boundaries_Vip` already exists. Overwriting it in-memory.
  self._check_key(key, self.keys(), self._shared_keys)
/home/yhchenmath/anaconda3/envs/cellseg/lib/python3.9/site-packages/spatialdata/_core/_elements.py:96: UserWarning: Key `vizgen_boundaries_CA2_IG_FC` already exists. Overwriting it in-memory.
  self._check_key(key, self.keys(), self._shared_keys)
/home/yhchenmath/anaconda3/envs/cellseg/lib/python3.9/site-packages/spatialdata/_core/_elements.py:96: UserWarning: Key `vizgen_boundaries_Sst` already exists. Overwriting it in-memory.
  self._check_key(key, self.keys(), self._shared_keys)
/home/yhchenmath/anaconda3/envs/cellseg/lib/python3.9/site-packages/spatialdata/_core/_elements.py:96: UserWarning: Key `vizgen_boundaries_SMC_Peri` already exists. Overwriting it in-memory.
  self._check_key(key, self.keys(), self._shared_keys)
/home/yhchenmath/anaconda3/envs/cellseg/lib/python3.9/site-packages/spatialdata/_core/_elements.py:96: UserWarning: Key `vizgen_boundaries_Lamp5` already exists. Overwriting it in-memory.
  self._check_key(key, self.keys(), self._shared_keys)
/home/yhchenmath/anaconda3/envs/cellseg/lib/python3.9/site-packages/spatialdata/_core/_elements.py:96: UserWarning: Key `vizgen_boundaries_L2_3_IT_RHP` already exists. Overwriting it in-memory.
  self._check_key(key, self.keys(), self._shared_keys)
/home/yhchenmath/anaconda3/envs/cellseg/lib/python3.9/site-packages/spatialdata/_core/_elements.py:96: UserWarning: Key `vizgen_boundaries_L5_PT_CTX` already exists. Overwriting it in-memory.
  self._check_key(key, self.keys(), self._shared_keys)
/home/yhchenmath/anaconda3/envs/cellseg/lib/python3.9/site-packages/spatialdata/_core/_elements.py:96: UserWarning: Key `vizgen_boundaries_L2_3_IT_PPP` already exists. Overwriting it in-memory.
  self._check_key(key, self.keys(), self._shared_keys)
/home/yhchenmath/anaconda3/envs/cellseg/lib/python3.9/site-packages/spatialdata/_core/_elements.py:96: UserWarning: Key `vizgen_boundaries_L6_IT_CTX` already exists. Overwriting it in-memory.
  self._check_key(key, self.keys(), self._shared_keys)
/home/yhchenmath/anaconda3/envs/cellseg/lib/python3.9/site-packages/spatialdata/_core/_elements.py:96: UserWarning: Key `vizgen_boundaries_L6_CT_CTX` already exists. Overwriting it in-memory.
  self._check_key(key, self.keys(), self._shared_keys)
/home/yhchenmath/anaconda3/envs/cellseg/lib/python3.9/site-packages/spatialdata/_core/_elements.py:96: UserWarning: Key `vizgen_boundaries_CT_SUB` already exists. Overwriting it in-memory.
  self._check_key(key, self.keys(), self._shared_keys)
/home/yhchenmath/anaconda3/envs/cellseg/lib/python3.9/site-packages/spatialdata/_core/_elements.py:96: UserWarning: Key `vizgen_boundaries_L6b_CT_ENT` already exists. Overwriting it in-memory.
  self._check_key(key, self.keys(), self._shared_keys)
/home/yhchenmath/anaconda3/envs/cellseg/lib/python3.9/site-packages/spatialdata/_core/_elements.py:96: UserWarning: Key `vizgen_boundaries_L6b_CTX` already exists. Overwriting it in-memory.
  self._check_key(key, self.keys(), self._shared_keys)
/home/yhchenmath/anaconda3/envs/cellseg/lib/python3.9/site-packages/spatialdata/_core/_elements.py:96: UserWarning: Key `vizgen_boundaries_Pvalb` already exists. Overwriting it in-memory.
  self._check_key(key, self.keys(), self._shared_keys)
/home/yhchenmath/anaconda3/envs/cellseg/lib/python3.9/site-packages/spatialdata/_core/_elements.py:96: UserWarning: Key `vizgen_boundaries_L5_PPP` already exists. Overwriting it in-memory.
  self._check_key(key, self.keys(), self._shared_keys)
/home/yhchenmath/anaconda3/envs/cellseg/lib/python3.9/site-packages/spatialdata/_core/_elements.py:96: UserWarning: Key `vizgen_boundaries_VLMC` already exists. Overwriting it in-memory.
  self._check_key(key, self.keys(), self._shared_keys)
/home/yhchenmath/anaconda3/envs/cellseg/lib/python3.9/site-packages/spatialdata/_core/_elements.py:96: UserWarning: Key `vizgen_boundaries_L2_IT_ENTm` already exists. Overwriting it in-memory.
  self._check_key(key, self.keys(), self._shared_keys)
/home/yhchenmath/anaconda3/envs/cellseg/lib/python3.9/site-packages/spatialdata/_core/_elements.py:96: UserWarning: Key `vizgen_boundaries_L2_3_IT_ENTl` already exists. Overwriting it in-memory.
  self._check_key(key, self.keys(), self._shared_keys)
/home/yhchenmath/anaconda3/envs/cellseg/lib/python3.9/site-packages/spatialdata/_core/_elements.py:96: UserWarning: Key `vizgen_boundaries_Sst_Chodl` already exists. Overwriting it in-memory.
  self._check_key(key, self.keys(), self._shared_keys)
/home/yhchenmath/anaconda3/envs/cellseg/lib/python3.9/site-packages/spatialdata/_core/_elements.py:96: UserWarning: Key `vizgen_boundaries_L5_6_IT_TPE_ENT` already exists. Overwriting it in-memory.
  self._check_key(key, self.keys(), self._shared_keys)
/home/yhchenmath/anaconda3/envs/cellseg/lib/python3.9/site-packages/spatialdata/_core/_elements.py:96: UserWarning: Key `vizgen_boundaries_L2_IT_ENTl` already exists. Overwriting it in-memory.
  self._check_key(key, self.keys(), self._shared_keys)
/home/yhchenmath/anaconda3/envs/cellseg/lib/python3.9/site-packages/spatialdata/_core/_elements.py:96: UserWarning: Key `vizgen_boundaries_L2_3_IT_CTX` already exists. Overwriting it in-memory.
  self._check_key(key, self.keys(), self._shared_keys)
/home/yhchenmath/anaconda3/envs/cellseg/lib/python3.9/site-packages/spatialdata/_core/_elements.py:96: UserWarning: Key `vizgen_boundaries_NP_SUB` already exists. Overwriting it in-memory.
  self._check_key(key, self.keys(), self._shared_keys)
/home/yhchenmath/anaconda3/envs/cellseg/lib/python3.9/site-packages/spatialdata/_core/_elements.py:96: UserWarning: Key `vizgen_boundaries_L4_5_IT_CTX` already exists. Overwriting it in-memory.
  self._check_key(key, self.keys(), self._shared_keys)
/home/yhchenmath/anaconda3/envs/cellseg/lib/python3.9/site-packages/spatialdata/_core/_elements.py:96: UserWarning: Key `vizgen_boundaries_L3_IT_ENT` already exists. Overwriting it in-memory.
  self._check_key(key, self.keys(), self._shared_keys)
INFO     Value for parameter 'color' appears to be a color, using it as such.
INFO     Value for parameter 'color' appears to be a color, using it as such.
INFO     Value for parameter 'color' appears to be a color, using it as such.
INFO     Value for parameter 'color' appears to be a color, using it as such.
INFO     Value for parameter 'color' appears to be a color, using it as such.
INFO     Value for parameter 'color' appears to be a color, using it as such.
INFO     Value for parameter 'color' appears to be a color, using it as such.
INFO     Value for parameter 'color' appears to be a color, using it as such.
INFO     Value for parameter 'color' appears to be a color, using it as such.
INFO     Value for parameter 'color' appears to be a color, using it as such.
INFO     Value for parameter 'color' appears to be a color, using it as such.
INFO     Value for parameter 'color' appears to be a color, using it as such.
INFO     Value for parameter 'color' appears to be a color, using it as such.
INFO     Value for parameter 'color' appears to be a color, using it as such.
INFO     Value for parameter 'color' appears to be a color, using it as such.
INFO     Value for parameter 'color' appears to be a color, using it as such.
INFO     Value for parameter 'color' appears to be a color, using it as such.
INFO     Value for parameter 'color' appears to be a color, using it as such.
INFO     Value for parameter 'color' appears to be a color, using it as such.
INFO     Value for parameter 'color' appears to be a color, using it as such.
INFO     Value for parameter 'color' appears to be a color, using it as such.
INFO     Value for parameter 'color' appears to be a color, using it as such.
INFO     Value for parameter 'color' appears to be a color, using it as such.
INFO     Value for parameter 'color' appears to be a color, using it as such.
INFO     Value for parameter 'color' appears to be a color, using it as such.
INFO     Value for parameter 'color' appears to be a color, using it as such.
INFO     Value for parameter 'color' appears to be a color, using it as such.
INFO     Value for parameter 'color' appears to be a color, using it as such.
INFO     Value for parameter 'color' appears to be a color, using it as such.
INFO     Value for parameter 'color' appears to be a color, using it as such.
INFO     Value for parameter 'color' appears to be a color, using it as such.
INFO     Value for parameter 'color' appears to be a color, using it as such.
INFO     Value for parameter 'color' appears to be a color, using it as such.
INFO     Value for parameter 'color' appears to be a color, using it as such.
INFO     Value for parameter 'color' appears to be a color, using it as such.
INFO     Value for parameter 'color' appears to be a color, using it as such.
INFO     Value for parameter 'color' appears to be a color, using it as such.
INFO     Value for parameter 'color' appears to be a color, using it as such.
INFO     Value for parameter 'color' appears to be a color, using it as such.
INFO     Value for parameter 'color' appears to be a color, using it as such.
INFO     Value for parameter 'color' appears to be a color, using it as such.
INFO     Value for parameter 'color' appears to be a color, using it as such.
INFO     Value for parameter 'color' appears to be a color, using it as such.
INFO     Value for parameter 'color' appears to be a color, using it as such.
INFO     Value for parameter 'color' appears to be a color, using it as such.
INFO     Value for parameter 'color' appears to be a color, using it as such.
INFO     Value for parameter 'color' appears to be a color, using it as such.
INFO     Value for parameter 'color' appears to be a color, using it as such.
INFO     Value for parameter 'color' appears to be a color, using it as such.
[18]:
(3974.3889155210727, 7523.4856912948735, 1824.441417437626, 764.9432837989315)
[19]:
dapi = np.load("./stereoseq_dapi.npy")[None, :, :]
import spatialdata as sd
gdf_stereoseq = append_xenium_boundary(mask_stereoseq, None, None, celltype = adata_st_cellart_stereoseq.obs["celltype"])
boundaries = sd.models.ShapesModel.parse(gdf_stereoseq)
img = sd.models.Image2DModel.parse(dapi, dims=("c", "x", "y"))
sdata_stereoseq = sd.SpatialData()
sdata_stereoseq.shapes["cell_boundaries"] = boundaries
sdata_stereoseq.images["dapi"] = img
import math
theta = - math.pi * 1.35 / 6
rotation = sd.transformations.Affine(
[
[math.cos(theta), -math.sin(theta), 0],
[math.sin(theta), math.cos(theta), 0],
[0, 0, 1],
],
input_axes=("x", "y"),
output_axes=("x", "y"),
)
sd.transformations.set_transformation(sdata_stereoseq.images["dapi"], rotation, to_coordinate_system="global")
sd.transformations.set_transformation(sdata_stereoseq.shapes["cell_boundaries"], rotation, to_coordinate_system="global")
sdata_stereoseq.shapes["cell_boundaries_rotated"] = sd.transform(sdata_stereoseq.shapes["cell_boundaries"], to_coordinate_system="global")
x_min, x_max, y_min, y_max = -780, -240, 3360, 5520
sdata_roi = sdata_stereoseq.query.bounding_box(
min_coordinate=[x_min, y_min], max_coordinate=[x_max, y_max], axes=("y", "x"), target_coordinate_system="global"
)
ct_col = sdata_roi.shapes["cell_boundaries_rotated"].celltype
cts = sdata_roi.shapes["cell_boundaries_rotated"].celltype.unique()
for ct in cts:
sdata_roi.shapes[f"cell_boundaries_rotated_{ct.replace(' ', '_').replace('/', '_').replace('-', '_')}"] = sdata_roi.shapes["cell_boundaries_rotated"][ct_col == ct]
center = sdata_roi.shapes["cell_boundaries_rotated_DG"].geometry.centroid
# Drop all centroids in [-250, -110] [4400, 4600]
sdata_roi.shapes["cell_boundaries_rotated_DG"] = sdata_roi.shapes["cell_boundaries_rotated_DG"][
(sdata_roi.shapes["cell_boundaries_rotated_DG"].geometry.centroid.y < -400) |
(sdata_roi.shapes["cell_boundaries_rotated_DG"].geometry.centroid.y > -105) |
(sdata_roi.shapes["cell_boundaries_rotated_DG"].geometry.centroid.x < 4400) |
(sdata_roi.shapes["cell_boundaries_rotated_DG"].geometry.centroid.x > 4600)
]
import matplotlib.pyplot as plt
fig, ax = plt.subplots(1, 1, figsize=(20, 12))
tmp = None
draw_cts = sdata_roi.shapes["cell_boundaries_rotated"].celltype.unique().tolist()
for ct in draw_cts:
color = celltype_mapping_renamed[ct.replace(' ', '_').replace('/', '_').replace('-', '_')]
if tmp is None:
tmp = sdata_roi.pl.render_shapes(
f"cell_boundaries_rotated_{ct.replace(' ', '_').replace('/', '_').replace('-', '_')}",
color=color, fill_alpha=0.4, outline_width=0.5, outline_color = color, outline_alpha=1
)
else:
tmp = tmp.pl.render_shapes(
f"cell_boundaries_rotated_{ct.replace(' ', '_').replace('/', '_').replace('-', '_')}",
color=color, fill_alpha=0.4, outline_width=0.5, outline_color = color, outline_alpha=1
)
tmp.pl.show(coordinate_systems="global", title="", frameon=False, legend_loc='none', return_ax=True, ax=ax)
ax.axis("off")
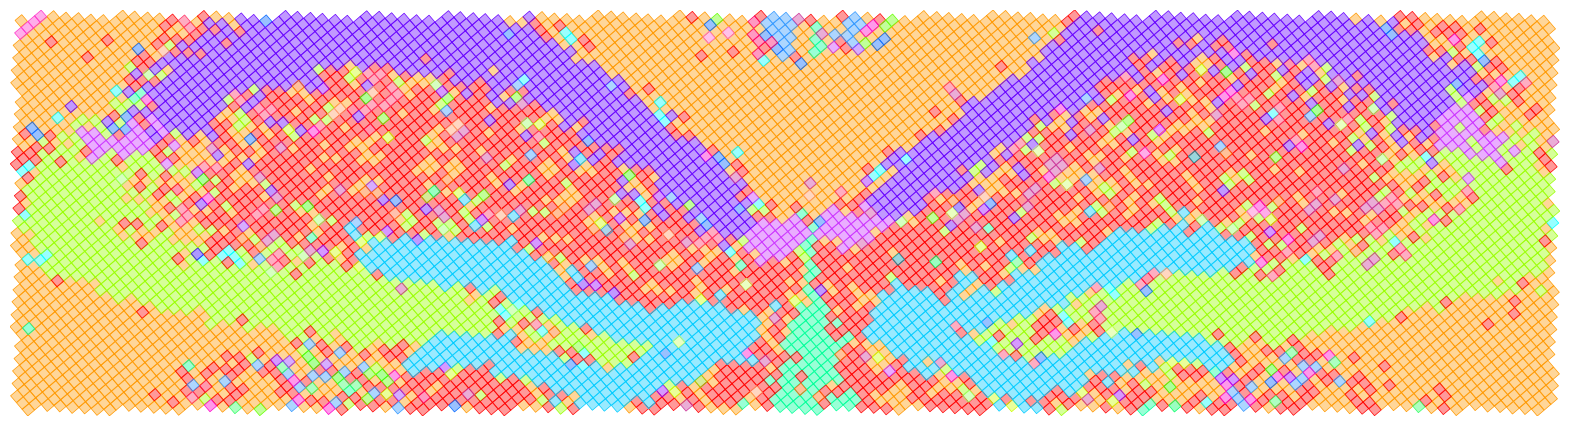
# RCTD
adata_st_rctd_stereoseq = sc.read_h5ad("./stereoseq_bin50.h5ad")
import pandas as pd
rctd_result = pd.read_csv("./stereoseq_rctd_results.csv", index_col=0)
# Index -> String
rctd_result.index = rctd_result.index.astype(int).astype(str)
adata_st_rctd_stereoseq = adata_st_rctd_stereoseq[rctd_result.index]
adata_st_rctd_stereoseq.obs["celltype"] = rctd_result["first_type"]
# Replace - to _
adata_st_rctd_stereoseq.obs["celltype"] = adata_st_rctd_stereoseq.obs["celltype"].str.replace("-", "_")
# Filter
sc.pp.filter_cells(adata_st_rctd_stereoseq, min_counts=500)
# Mapping rctd
adata_st_rctd_stereoseq.obs["celltype"] = adata_st_rctd_stereoseq.obs["celltype"].map({
k.replace(" ", "_").replace("/", "_").replace("-", "_"): k for k, _ in celltype_mapping.items()
})
adata_st_rctd_stereoseq.obs["x"] = adata_st_rctd_stereoseq.obs["x"] // 4
adata_st_rctd_stereoseq.obs["y"] = adata_st_rctd_stereoseq.obs["y"] // 4
# x, y // 4
from shapely.geometry import Polygon
from skimage.measure import find_contours
import geopandas as gpd
# Create a gdf: index adata_st_rctd_stereoseq.obs_names, geometry: center is (x, y), square, width is 12.5
gdf_rctd = gpd.GeoDataFrame(
index=adata_st_rctd_stereoseq.obs_names,
geometry=[
Polygon([
(x - 6.25, y - 6.25),
(x + 6.25, y - 6.25),
(x + 6.25, y + 6.25),
(x - 6.25, y + 6.25)
])
for x, y in zip(adata_st_rctd_stereoseq.obs["x"], adata_st_rctd_stereoseq.obs["y"])
]
)
boundaries = sd.models.ShapesModel.parse(gdf_rctd)
boundaries["celltype"] = adata_st_rctd_stereoseq.obs["celltype"].values
sdata_stereoseq.shapes["rctd"] = boundaries
sd.transformations.set_transformation(sdata_stereoseq.shapes["rctd"], rotation, to_coordinate_system="global")
x_min, x_max, y_min, y_max = -780, -240, 3360, 5520
sdata_roi = sdata_stereoseq.query.bounding_box(
min_coordinate=[x_min, y_min], max_coordinate=[x_max, y_max], axes=("y", "x"), target_coordinate_system="global"
)
ct_col = sdata_roi.shapes["rctd"].celltype
cts = sdata_roi.shapes["rctd"].celltype.unique()
for ct in cts:
sdata_roi.shapes[f"rctd_{ct.replace(' ', '_').replace('/', '_').replace('-', '_')}"] = sdata_roi.shapes["rctd"][ct_col == ct]
import matplotlib.pyplot as plt
fig, ax = plt.subplots(1, 1, figsize=(20, 12))
tmp = None
draw_cts = sdata_roi.shapes["rctd"].celltype.unique().tolist()
for ct in draw_cts:
color = celltype_mapping_renamed[ct.replace(' ', '_').replace('/', '_').replace('-', '_')]
if tmp is None:
tmp = sdata_roi.pl.render_shapes(
f"rctd_{ct.replace(' ', '_').replace('/', '_').replace('-', '_')}",
color=color, fill_alpha=0.4, outline_width=0.5, outline_color = color, outline_alpha=1
)
else:
tmp = tmp.pl.render_shapes(
f"rctd_{ct.replace(' ', '_').replace('/', '_').replace('-', '_')}",
color=color, fill_alpha=0.4, outline_width=0.5, outline_color = color, outline_alpha=1
)
tmp.pl.show(coordinate_systems="global", title="", frameon=False, legend_loc='none', return_ax=True, ax=ax)
ax.axis("off")
Not sdata provided
INFO     Transposing `data` of type: <class 'dask.array.core.Array'> to ('c', 'y', 'x').
INFO     Value for parameter 'color' appears to be a color, using it as such.
INFO     Value for parameter 'color' appears to be a color, using it as such.
INFO     Value for parameter 'color' appears to be a color, using it as such.
INFO     Value for parameter 'color' appears to be a color, using it as such.
INFO     Value for parameter 'color' appears to be a color, using it as such.
INFO     Value for parameter 'color' appears to be a color, using it as such.
INFO     Value for parameter 'color' appears to be a color, using it as such.
INFO     Value for parameter 'color' appears to be a color, using it as such.
INFO     Value for parameter 'color' appears to be a color, using it as such.
INFO     Value for parameter 'color' appears to be a color, using it as such.
INFO     Value for parameter 'color' appears to be a color, using it as such.
INFO     Value for parameter 'color' appears to be a color, using it as such.
INFO     Value for parameter 'color' appears to be a color, using it as such.
INFO     Value for parameter 'color' appears to be a color, using it as such.
INFO     Value for parameter 'color' appears to be a color, using it as such.
INFO     Value for parameter 'color' appears to be a color, using it as such.
INFO     Value for parameter 'color' appears to be a color, using it as such.
INFO     Value for parameter 'color' appears to be a color, using it as such.
INFO     Value for parameter 'color' appears to be a color, using it as such.
INFO     Value for parameter 'color' appears to be a color, using it as such.
INFO     Value for parameter 'color' appears to be a color, using it as such.
INFO     Value for parameter 'color' appears to be a color, using it as such.
INFO     Value for parameter 'color' appears to be a color, using it as such.
INFO     Value for parameter 'color' appears to be a color, using it as such.
INFO     Value for parameter 'color' appears to be a color, using it as such.
/tmp/ipykernel_3535210/381838012.py:38: UserWarning: Geometry is in a geographic CRS. Results from 'centroid' are likely incorrect. Use 'GeoSeries.to_crs()' to re-project geometries to a projected CRS before this operation.

  center = sdata_roi.shapes["cell_boundaries_rotated_DG"].geometry.centroid
/tmp/ipykernel_3535210/381838012.py:41: UserWarning: Geometry is in a geographic CRS. Results from 'centroid' are likely incorrect. Use 'GeoSeries.to_crs()' to re-project geometries to a projected CRS before this operation.

  (sdata_roi.shapes["cell_boundaries_rotated_DG"].geometry.centroid.y < -400) |
/tmp/ipykernel_3535210/381838012.py:42: UserWarning: Geometry is in a geographic CRS. Results from 'centroid' are likely incorrect. Use 'GeoSeries.to_crs()' to re-project geometries to a projected CRS before this operation.

  (sdata_roi.shapes["cell_boundaries_rotated_DG"].geometry.centroid.y > -105) |
/tmp/ipykernel_3535210/381838012.py:43: UserWarning: Geometry is in a geographic CRS. Results from 'centroid' are likely incorrect. Use 'GeoSeries.to_crs()' to re-project geometries to a projected CRS before this operation.

  (sdata_roi.shapes["cell_boundaries_rotated_DG"].geometry.centroid.x < 4400) |
/tmp/ipykernel_3535210/381838012.py:44: UserWarning: Geometry is in a geographic CRS. Results from 'centroid' are likely incorrect. Use 'GeoSeries.to_crs()' to re-project geometries to a projected CRS before this operation.

  (sdata_roi.shapes["cell_boundaries_rotated_DG"].geometry.centroid.x > 4600)
/home/yhchenmath/anaconda3/envs/cellseg/lib/python3.9/site-packages/spatialdata/_core/_elements.py:96: UserWarning: Key `cell_boundaries_rotated_DG` already exists. Overwriting it in-memory.
  self._check_key(key, self.keys(), self._shared_keys)
INFO     Value for parameter 'color' appears to be a color, using it as such.
INFO     Value for parameter 'color' appears to be a color, using it as such.
INFO     Value for parameter 'color' appears to be a color, using it as such.
INFO     Value for parameter 'color' appears to be a color, using it as such.
INFO     Value for parameter 'color' appears to be a color, using it as such.
/tmp/ipykernel_3535210/381838012.py:76: ImplicitModificationWarning: Trying to modify attribute `.obs` of view, initializing view as actual.
  adata_st_rctd_stereoseq.obs["celltype"] = rctd_result["first_type"]
INFO     Value for parameter 'color' appears to be a color, using it as such.
INFO     Value for parameter 'color' appears to be a color, using it as such.
INFO     Value for parameter 'color' appears to be a color, using it as such.
INFO     Value for parameter 'color' appears to be a color, using it as such.
INFO     Value for parameter 'color' appears to be a color, using it as such.
INFO     Value for parameter 'color' appears to be a color, using it as such.
INFO     Value for parameter 'color' appears to be a color, using it as such.
INFO     Value for parameter 'color' appears to be a color, using it as such.
INFO     Value for parameter 'color' appears to be a color, using it as such.
INFO     Value for parameter 'color' appears to be a color, using it as such.
INFO     Value for parameter 'color' appears to be a color, using it as such.
INFO     Value for parameter 'color' appears to be a color, using it as such.
INFO     Value for parameter 'color' appears to be a color, using it as such.
INFO     Value for parameter 'color' appears to be a color, using it as such.
INFO     Value for parameter 'color' appears to be a color, using it as such.
INFO     Value for parameter 'color' appears to be a color, using it as such.
INFO     Value for parameter 'color' appears to be a color, using it as such.
INFO     Value for parameter 'color' appears to be a color, using it as such.
INFO     Value for parameter 'color' appears to be a color, using it as such.
INFO     Value for parameter 'color' appears to be a color, using it as such.
INFO     Value for parameter 'color' appears to be a color, using it as such.
INFO     Value for parameter 'color' appears to be a color, using it as such.
INFO     Value for parameter 'color' appears to be a color, using it as such.
INFO     Value for parameter 'color' appears to be a color, using it as such.
INFO     Value for parameter 'color' appears to be a color, using it as such.
INFO     Value for parameter 'color' appears to be a color, using it as such.
INFO     Value for parameter 'color' appears to be a color, using it as such.
INFO     Value for parameter 'color' appears to be a color, using it as such.
INFO     Value for parameter 'color' appears to be a color, using it as such.
INFO     Value for parameter 'color' appears to be a color, using it as such.
INFO     Value for parameter 'color' appears to be a color, using it as such.
INFO     Value for parameter 'color' appears to be a color, using it as such.
INFO     Value for parameter 'color' appears to be a color, using it as such.
INFO     Value for parameter 'color' appears to be a color, using it as such.
INFO     Value for parameter 'color' appears to be a color, using it as such.
[19]:
(3343.0596353603332, 5537.414694553214, -222.4643149808377, -797.4701232662396)
[21]:
from spatialdata_io import xenium
import numpy as np

sdata = xenium(
    path="/import/home2/yhchenmath/Dataset/CellSeg/Xenium_mouse_brain/",)


mask_cellart = np.load("xenium_segmentation_mask.npy").astype("int32")
adata_st_cellart_xenium = sc.read_h5ad("xenium_cell_deconv.h5ad")

adata_st_10x = sc.read_h5ad("xenium_10X_scvi.h5ad")
sdata.shapes["cell_boundaries"]["celltype"] = adata_st_10x.obs["C_scANVI"].values

import geopandas
import spatialdata as sd
import scanpy as sc
df = geopandas.read_file("proseg-cell-polygons.geojson")
df.set_index("cell", inplace=True)

boundaries = sd.models.ShapesModel.parse(df)
sdata.shapes["proseg_boundaries"] = boundaries
seg_transformation = sd.transformations.get_transformation(sdata.shapes["nucleus_boundaries"])
sd.transformations.set_transformation(sdata.shapes["proseg_boundaries"], seg_transformation,
                                        to_coordinate_system="global")
sdata.shapes["proseg_boundaries"].index = sdata.shapes["proseg_boundaries"].index.astype(str)

proseg_adata = sc.read_h5ad("proseg_scvi.h5ad")

sdata.shapes["proseg_boundaries"] = sdata.shapes["proseg_boundaries"].loc[proseg_adata.obs_names.tolist()]
sdata.shapes["proseg_boundaries"]["celltype"] = proseg_adata.obs["C_scANVI"].values

mask_baysor = np.load("xenium_baysor_segmentation_mask.npy")
adata_st_baysor = sc.read_h5ad("baysor_scvi.h5ad")

append_xenium_boundary(mask_cellart, sdata, "cellart_boundaries", celltype=adata_st_cellart_xenium.obs["celltype"])
append_xenium_boundary(mask_baysor, sdata, "baysor_boundaries", celltype=adata_st_baysor.obs["C_scANVI"])
INFO reading /import/home2/yhchenmath/Dataset/CellSeg/Xenium_mouse_brain/cell_feature_matrix.h5
/tmp/ipykernel_3535210/1737121195.py:4: DeprecationWarning: The default value of `cells_as_circles` will change to `False` in the next release. Please pass `True` explicitly to maintain the current behavior.
  sdata = xenium(
/home/yhchenmath/anaconda3/envs/cellseg/lib/python3.9/site-packages/spatialdata/_core/_elements.py:96: UserWarning: Key `proseg_boundaries` already exists. Overwriting it in-memory.
  self._check_key(key, self.keys(), self._shared_keys)
/tmp/ipykernel_3535210/3384667856.py:92: UserWarning: Geometry is in a geographic CRS. Results from 'centroid' are likely incorrect. Use 'GeoSeries.to_crs()' to re-project geometries to a projected CRS before this operation.

  center_df = sdata.shapes[append_name].centroid
/tmp/ipykernel_3535210/3384667856.py:92: UserWarning: Geometry is in a geographic CRS. Results from 'centroid' are likely incorrect. Use 'GeoSeries.to_crs()' to re-project geometries to a projected CRS before this operation.

  center_df = sdata.shapes[append_name].centroid
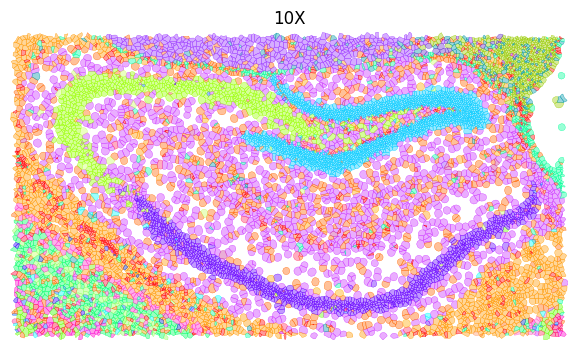
[22]:
x_min, x_max, y_min, y_max = 19500, 26000, 11000, 23000
sdata_roi = sdata.query.bounding_box(
    min_coordinate=[x_min, y_min], max_coordinate=[x_max, y_max], axes=("y", "x"), target_coordinate_system="global"
)
/home/yhchenmath/anaconda3/envs/cellseg/lib/python3.9/site-packages/anndata/_core/anndata.py:183: ImplicitModificationWarning: Transforming to str index.
  warnings.warn("Transforming to str index.", ImplicitModificationWarning)
[23]:
ct_col = sdata_roi.shapes["cell_boundaries"].celltype
cts = sdata_roi.shapes["cell_boundaries"].celltype.unique()
for ct in cts:
sdata_roi.shapes[f"cell_boundaries_{ct.replace(' ', '_').replace('/', '_').replace('-', '_')}"] = sdata_roi.shapes["cell_boundaries"][ct_col == ct]
ct_col = sdata_roi.shapes["baysor_boundaries"].celltype
cts = sdata_roi.shapes["baysor_boundaries"].celltype.unique()
for ct in cts:
sdata_roi.shapes[f"baysor_boundaries_{ct.replace(' ', '_').replace('/', '_').replace('-', '_')}"] = sdata_roi.shapes["baysor_boundaries"][ct_col == ct]
ct_col = sdata_roi.shapes["proseg_boundaries"].celltype
cts = sdata_roi.shapes["proseg_boundaries"].celltype.unique()
for ct in cts:
sdata_roi.shapes[f"proseg_boundaries_{ct.replace(' ', '_').replace('/', '_').replace('-', '_')}"] = sdata_roi.shapes["proseg_boundaries"][ct_col == ct]
fig, ax = plt.subplots(1, 1, figsize=(8, 4))
tmp = None # sdata_roi_1.pl.render_images("morphology_focus")
draw_cts = sdata_roi.shapes["cell_boundaries"].celltype.unique().tolist()
for ct in draw_cts:
color = celltype_mapping_renamed[ct.replace(' ', '_').replace('/', '_').replace('-', '_')]
if tmp is None:
tmp = sdata_roi.pl.render_shapes(
f"cell_boundaries_{ct.replace(' ', '_').replace('/', '_').replace('-', '_')}",
color=color, fill_alpha=0.4, outline_width=0.25, outline_color = color, outline_alpha=1
)
else:
tmp = tmp.pl.render_shapes(
f"cell_boundaries_{ct.replace(' ', '_').replace('/', '_').replace('-', '_')}",
color=color, fill_alpha=0.4, outline_width=0.25, outline_color = color, outline_alpha=1
)
tmp.pl.show(coordinate_systems="global", title="10X", frameon=False, legend_loc='none', return_ax=True, ax=ax)
ax.axis("off")
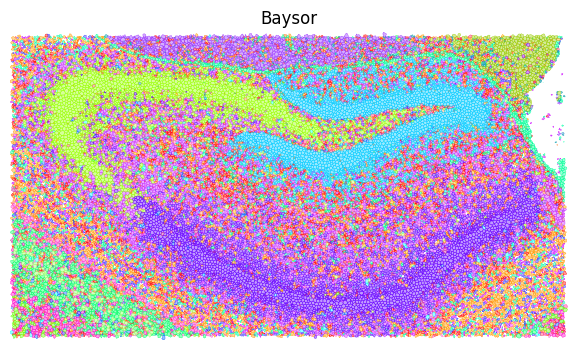
fig, ax = plt.subplots(1, 1, figsize=(8, 4))
tmp = None # sdata_roi_1.pl.render_images("morphology_focus")
draw_cts = sdata_roi.shapes["baysor_boundaries"].celltype.unique().tolist()
for ct in draw_cts:
color = celltype_mapping_renamed[ct.replace(' ', '_').replace('/', '_').replace('-', '_')]
if tmp is None:
tmp = sdata_roi.pl.render_shapes(
f"baysor_boundaries_{ct.replace(' ', '_').replace('/', '_').replace('-', '_')}",
color=color, fill_alpha=0.4, outline_width=0.25, outline_color = color, outline_alpha=1
)
else:
tmp = tmp.pl.render_shapes(
f"baysor_boundaries_{ct.replace(' ', '_').replace('/', '_').replace('-', '_')}",
color=color, fill_alpha=0.4, outline_width=0.25, outline_color = color, outline_alpha=1
)
tmp.pl.show(coordinate_systems="global", title="Baysor", frameon=False, legend_loc='none', return_ax=True, ax=ax)
ax.axis("off")
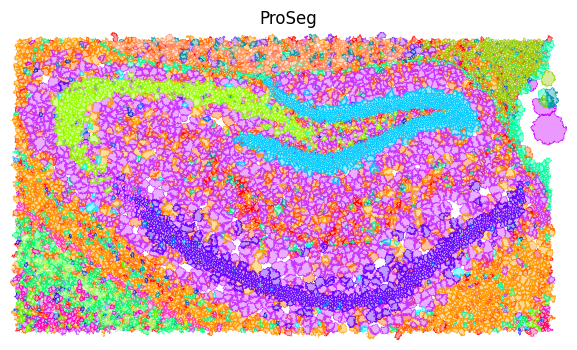
fig, ax = plt.subplots(1, 1, figsize=(8, 4))
tmp = None # sdata_roi_1.pl.render_images("morphology_focus")
draw_cts = sdata_roi.shapes["proseg_boundaries"].celltype.unique().tolist()
for ct in draw_cts:
color = celltype_mapping_renamed[ct.replace(' ', '_').replace('/', '_').replace('-', '_')]
if tmp is None:
tmp = sdata_roi.pl.render_shapes(
f"proseg_boundaries_{ct.replace(' ', '_').replace('/', '_').replace('-', '_')}",
color=color, fill_alpha=0.4, outline_width=0.25, outline_color = color, outline_alpha=1
)
else:
tmp = tmp.pl.render_shapes(
f"proseg_boundaries_{ct.replace(' ', '_').replace('/', '_').replace('-', '_')}",
color=color, fill_alpha=0.4, outline_width=0.25, outline_color = color, outline_alpha=1
)
tmp.pl.show(coordinate_systems="global", title="ProSeg", frameon=False, legend_loc='none', return_ax=True, ax=ax)
ax.axis("off")
INFO     Value for parameter 'color' appears to be a color, using it as such.
INFO     Value for parameter 'color' appears to be a color, using it as such.
INFO     Value for parameter 'color' appears to be a color, using it as such.
INFO     Value for parameter 'color' appears to be a color, using it as such.
INFO     Value for parameter 'color' appears to be a color, using it as such.
INFO     Value for parameter 'color' appears to be a color, using it as such.
INFO     Value for parameter 'color' appears to be a color, using it as such.
INFO     Value for parameter 'color' appears to be a color, using it as such.
INFO     Value for parameter 'color' appears to be a color, using it as such.
INFO     Value for parameter 'color' appears to be a color, using it as such.
INFO     Value for parameter 'color' appears to be a color, using it as such.
INFO     Value for parameter 'color' appears to be a color, using it as such.
INFO     Value for parameter 'color' appears to be a color, using it as such.
INFO     Value for parameter 'color' appears to be a color, using it as such.
INFO     Value for parameter 'color' appears to be a color, using it as such.
INFO     Value for parameter 'color' appears to be a color, using it as such.
INFO     Value for parameter 'color' appears to be a color, using it as such.
INFO     Value for parameter 'color' appears to be a color, using it as such.
INFO     Value for parameter 'color' appears to be a color, using it as such.
INFO     Value for parameter 'color' appears to be a color, using it as such.
INFO     Value for parameter 'color' appears to be a color, using it as such.
INFO     Value for parameter 'color' appears to be a color, using it as such.
INFO     Value for parameter 'color' appears to be a color, using it as such.
INFO     Value for parameter 'color' appears to be a color, using it as such.
INFO     Value for parameter 'color' appears to be a color, using it as such.
INFO     Value for parameter 'color' appears to be a color, using it as such.
INFO     Value for parameter 'color' appears to be a color, using it as such.
INFO     Value for parameter 'color' appears to be a color, using it as such.
INFO     Value for parameter 'color' appears to be a color, using it as such.
INFO     Value for parameter 'color' appears to be a color, using it as such.
INFO     Value for parameter 'color' appears to be a color, using it as such.
INFO     Value for parameter 'color' appears to be a color, using it as such.
INFO     Value for parameter 'color' appears to be a color, using it as such.
INFO     Value for parameter 'color' appears to be a color, using it as such.
INFO     Value for parameter 'color' appears to be a color, using it as such.
INFO     Value for parameter 'color' appears to be a color, using it as such.
INFO     Value for parameter 'color' appears to be a color, using it as such.
INFO     Value for parameter 'color' appears to be a color, using it as such.
INFO     Value for parameter 'color' appears to be a color, using it as such.
INFO     Value for parameter 'color' appears to be a color, using it as such.
INFO     Value for parameter 'color' appears to be a color, using it as such.
INFO     Value for parameter 'color' appears to be a color, using it as such.
INFO     Value for parameter 'color' appears to be a color, using it as such.
INFO     Value for parameter 'color' appears to be a color, using it as such.
INFO     Value for parameter 'color' appears to be a color, using it as such.
INFO     Value for parameter 'color' appears to be a color, using it as such.
INFO     Value for parameter 'color' appears to be a color, using it as such.
INFO     Value for parameter 'color' appears to be a color, using it as such.
INFO     Value for parameter 'color' appears to be a color, using it as such.
INFO     Value for parameter 'color' appears to be a color, using it as such.
INFO     Value for parameter 'color' appears to be a color, using it as such.
INFO     Value for parameter 'color' appears to be a color, using it as such.
INFO     Value for parameter 'color' appears to be a color, using it as such.
INFO     Value for parameter 'color' appears to be a color, using it as such.
INFO     Value for parameter 'color' appears to be a color, using it as such.
INFO     Value for parameter 'color' appears to be a color, using it as such.
INFO     Value for parameter 'color' appears to be a color, using it as such.
INFO     Value for parameter 'color' appears to be a color, using it as such.
INFO     Value for parameter 'color' appears to be a color, using it as such.
INFO     Value for parameter 'color' appears to be a color, using it as such.
INFO     Value for parameter 'color' appears to be a color, using it as such.
INFO     Value for parameter 'color' appears to be a color, using it as such.
INFO     Value for parameter 'color' appears to be a color, using it as such.
INFO     Value for parameter 'color' appears to be a color, using it as such.
INFO     Value for parameter 'color' appears to be a color, using it as such.
INFO     Value for parameter 'color' appears to be a color, using it as such.
INFO     Value for parameter 'color' appears to be a color, using it as such.
INFO     Value for parameter 'color' appears to be a color, using it as such.
INFO     Value for parameter 'color' appears to be a color, using it as such.
INFO     Value for parameter 'color' appears to be a color, using it as such.
INFO     Value for parameter 'color' appears to be a color, using it as such.
INFO     Value for parameter 'color' appears to be a color, using it as such.
INFO     Value for parameter 'color' appears to be a color, using it as such.
INFO     Value for parameter 'color' appears to be a color, using it as such.
INFO     Value for parameter 'color' appears to be a color, using it as such.
INFO     Value for parameter 'color' appears to be a color, using it as such.
INFO     Value for parameter 'color' appears to be a color, using it as such.
INFO     Value for parameter 'color' appears to be a color, using it as such.
INFO     Value for parameter 'color' appears to be a color, using it as such.
INFO     Value for parameter 'color' appears to be a color, using it as such.
INFO     Value for parameter 'color' appears to be a color, using it as such.
INFO     Value for parameter 'color' appears to be a color, using it as such.
INFO     Value for parameter 'color' appears to be a color, using it as such.
INFO     Value for parameter 'color' appears to be a color, using it as such.
INFO     Value for parameter 'color' appears to be a color, using it as such.
INFO     Value for parameter 'color' appears to be a color, using it as such.
INFO     Value for parameter 'color' appears to be a color, using it as such.
INFO     Value for parameter 'color' appears to be a color, using it as such.
INFO     Value for parameter 'color' appears to be a color, using it as such.
INFO     Value for parameter 'color' appears to be a color, using it as such.
INFO     Value for parameter 'color' appears to be a color, using it as such.
INFO     Value for parameter 'color' appears to be a color, using it as such.
INFO     Value for parameter 'color' appears to be a color, using it as such.
INFO     Value for parameter 'color' appears to be a color, using it as such.
INFO     Value for parameter 'color' appears to be a color, using it as such.
INFO     Value for parameter 'color' appears to be a color, using it as such.
INFO     Value for parameter 'color' appears to be a color, using it as such.
INFO     Value for parameter 'color' appears to be a color, using it as such.
INFO     Value for parameter 'color' appears to be a color, using it as such.
INFO     Value for parameter 'color' appears to be a color, using it as such.
INFO     Value for parameter 'color' appears to be a color, using it as such.
INFO     Value for parameter 'color' appears to be a color, using it as such.
INFO     Value for parameter 'color' appears to be a color, using it as such.
INFO     Value for parameter 'color' appears to be a color, using it as such.
INFO     Value for parameter 'color' appears to be a color, using it as such.
INFO     Value for parameter 'color' appears to be a color, using it as such.
INFO     Value for parameter 'color' appears to be a color, using it as such.
INFO     Value for parameter 'color' appears to be a color, using it as such.
INFO     Value for parameter 'color' appears to be a color, using it as such.
INFO     Value for parameter 'color' appears to be a color, using it as such.
INFO     Value for parameter 'color' appears to be a color, using it as such.
INFO     Value for parameter 'color' appears to be a color, using it as such.
INFO     Value for parameter 'color' appears to be a color, using it as such.
INFO     Value for parameter 'color' appears to be a color, using it as such.
INFO     Value for parameter 'color' appears to be a color, using it as such.
INFO     Value for parameter 'color' appears to be a color, using it as such.
INFO     Value for parameter 'color' appears to be a color, using it as such.
INFO     Value for parameter 'color' appears to be a color, using it as such.
INFO     Value for parameter 'color' appears to be a color, using it as such.
INFO     Value for parameter 'color' appears to be a color, using it as such.
[23]:
(10802.93411764706, 23447.64, 26259.28329411765, 19271.048)
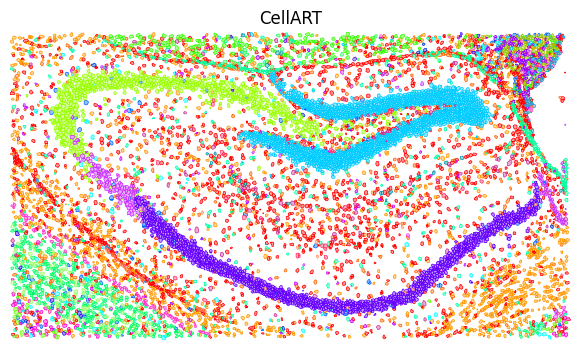
[24]:
# CellART
ct_col = sdata_roi.shapes["cellart_boundaries"].celltype
cts = sdata_roi.shapes["cellart_boundaries"].celltype.unique()
for ct in cts:
    sdata_roi.shapes[f"cellart_boundaries_{ct.replace(' ', '_').replace('/', '_').replace('-', '_')}"] = sdata_roi.shapes["cellart_boundaries"][ct_col == ct]

fig, ax = plt.subplots(1, 1, figsize=(8, 4))

tmp = None # sdata_roi_1.pl.render_images("morphology_focus")
draw_cts = sdata_roi.shapes["cellart_boundaries"].celltype.unique().tolist()
for ct in draw_cts:
    color = celltype_mapping_renamed[ct.replace(' ', '_').replace('/', '_').replace('-', '_')]
    if tmp is None:
        tmp = sdata_roi.pl.render_shapes(
        f"cellart_boundaries_{ct.replace(' ', '_').replace('/', '_').replace('-', '_')}",
        color=color, fill_alpha=0.4, outline_width=0.5, outline_color = color, outline_alpha=1
    )
    else:
        tmp = tmp.pl.render_shapes(
        f"cellart_boundaries_{ct.replace(' ', '_').replace('/', '_').replace('-', '_')}",
        color=color, fill_alpha=0.4, outline_width=0.5, outline_color = color, outline_alpha=1
    )
tmp.pl.show(coordinate_systems="global", title="CellART", frameon=False, legend_loc='none', return_ax=True, ax=ax)
ax.axis("off")
INFO     Value for parameter 'color' appears to be a color, using it as such.
INFO     Value for parameter 'color' appears to be a color, using it as such.
INFO     Value for parameter 'color' appears to be a color, using it as such.
INFO     Value for parameter 'color' appears to be a color, using it as such.
INFO     Value for parameter 'color' appears to be a color, using it as such.
INFO     Value for parameter 'color' appears to be a color, using it as such.
INFO     Value for parameter 'color' appears to be a color, using it as such.
INFO     Value for parameter 'color' appears to be a color, using it as such.
INFO     Value for parameter 'color' appears to be a color, using it as such.
INFO     Value for parameter 'color' appears to be a color, using it as such.
INFO     Value for parameter 'color' appears to be a color, using it as such.
INFO     Value for parameter 'color' appears to be a color, using it as such.
INFO     Value for parameter 'color' appears to be a color, using it as such.
INFO     Value for parameter 'color' appears to be a color, using it as such.
INFO     Value for parameter 'color' appears to be a color, using it as such.
INFO     Value for parameter 'color' appears to be a color, using it as such.
INFO     Value for parameter 'color' appears to be a color, using it as such.
INFO     Value for parameter 'color' appears to be a color, using it as such.
INFO     Value for parameter 'color' appears to be a color, using it as such.
INFO     Value for parameter 'color' appears to be a color, using it as such.
INFO     Value for parameter 'color' appears to be a color, using it as such.
INFO     Value for parameter 'color' appears to be a color, using it as such.
INFO     Value for parameter 'color' appears to be a color, using it as such.
INFO     Value for parameter 'color' appears to be a color, using it as such.
INFO     Value for parameter 'color' appears to be a color, using it as such.
INFO     Value for parameter 'color' appears to be a color, using it as such.
INFO     Value for parameter 'color' appears to be a color, using it as such.
INFO     Value for parameter 'color' appears to be a color, using it as such.
INFO     Value for parameter 'color' appears to be a color, using it as such.
INFO     Value for parameter 'color' appears to be a color, using it as such.
INFO     Value for parameter 'color' appears to be a color, using it as such.
INFO     Value for parameter 'color' appears to be a color, using it as such.
INFO     Value for parameter 'color' appears to be a color, using it as such.
INFO     Value for parameter 'color' appears to be a color, using it as such.
INFO     Value for parameter 'color' appears to be a color, using it as such.
INFO     Value for parameter 'color' appears to be a color, using it as such.
INFO     Value for parameter 'color' appears to be a color, using it as such.
INFO     Value for parameter 'color' appears to be a color, using it as such.
INFO     Value for parameter 'color' appears to be a color, using it as such.
INFO     Value for parameter 'color' appears to be a color, using it as such.
[24]:
(10920.0, 23098.823529411766, 26101.176470588238, 19409.411764705885)
Metric
[25]:
celltype_mapping = {
    'Astro': '#ff0000',
    'Oligo': '#ff9900',
    'L2/3 IT CTX': '#ccff00',
    'L4/5 IT CTX': '#33ff00',
    'L6 CT CTX': '#00ff66',
    'Sst': '#00ffff',
    'Pvalb': '#0066ff',
    'DG': '#00ccff',
    'L2/3 IT ENTl': '#9900ff',
    'L5 IT CTX': '#ff00cc',
    'L4 RSP-ACA': '#ff0066',
    'L5/6 IT TPE-ENT': '#ff0033',
    'Endo': '#ff6600',
    'L2 IT ENTl': '#99cc00',     # Changed from #ccff00
    'L5 PT CTX': '#66ff00',
    'Lamp5': '#cc3399',          # Changed from #ff0066
    'VLMC': '#00ff99',
    'L2/3 IT PPP': '#3399ff',    # Changed from #0066ff
    'Car3': '#3300ff',
    'CA1-ProS': '#6600ff',
    'SMC-Peri': '#cc00ff',
    'L6b CTX': '#ff33cc',        # Changed from #ff00cc
    'L5/6 NP CTX': '#ff3399',    # Changed from #ff0099
    'Sncg': '#ff3366',           # Changed from #ff0033
    'Vip': '#ff9966',            # Changed from #ff6600
    'L6 IT CTX': '#99ff66',      # Changed from #ccff00
    'CA3': '#99ff00',
    'L3 IT ENT': '#33ff66',      # Changed from #33ff00
    'Micro-PVM': '#00ffaa',      # Changed from #00ff99
    'CR': '#0099aa',             # Changed from #00ffff
    'L6 IT ENTl': '#3399cc',     # Changed from #0099ff
    'Sst Chodl': '#0033cc',      # Changed from #0033ff
    'L2 IT ENTm': '#6633cc',     # Changed from #6600ff
    'NP SUB': '#9933ff',         # Changed from #9900ff

    'CA2-IG-FC': '#cc33ff',      # Changed from #cc00ff
    'L5 PPP': '#ff33ff',         # Changed from #ff00ff
    'CT SUB': '#ff66cc',         # Changed from #ff0099
    'NP PPP': '#3333ff',         # Changed from #3300ff
    'L6b/CT ENT': '#ff6633',     # Changed from #ff3300
    'SUB-ProS': '#ffaa00',       # Changed from #ff9900
    'L2/3 IT RHP': '#ccff66',    # Changed from #ccff00

    'Others': '#F0F0F0'          # Grey, left unchanged
}

celltype_mapping_renamed = {
    k.replace(" ", "_").replace("/", "_").replace("-", "_"): v for k, v in celltype_mapping.items()
}
[26]:
import scanpy as sc

adata_dict = {
    "VisiumHD-CellART": sc.read_h5ad("hd_cell_deconv.h5ad"),
    "VisiumHD-RCTD": sc.read_h5ad("hd_rctd.h5ad"),
    "VisiumHD-Bin2Cell":  sc.read_h5ad("annotated_adata_bin2cell_scvi.h5ad"),
    "VisiumHD-StarDist": sc.read_h5ad("annotated_adata_stardist_scvi.h5ad"),

    "Xenium-CellART": sc.read_h5ad("xenium_cell_deconv.h5ad"),
    "Xenium-10X": sc.read_h5ad("xenium_10X_scvi.h5ad"),
    "Xenium-Baysor": sc.read_h5ad("baysor_scvi.h5ad"),
    "Xenium-ProSeg": sc.read_h5ad("proseg_scvi.h5ad"),

    "MERFISH-CellART": sc.read_h5ad("merfish_cell_deconv.h5ad"),
    "MERFISH-Vizgen": sc.read_h5ad("vizgen_scvi.h5ad"),

    "Stereoseq-CellART": sc.read_h5ad("stereoseq_cell_deconv.h5ad"),
    "Stereoseq-RCTD": sc.read_h5ad("bin50_annotated.h5ad")
}

import pandas as pd
gene_info = pd.read_csv("ensembl_ids.txt", index_col=None, header=None, sep="\t")
# Columns: ensembl_id, gene_name
gene_info.columns = ["ensembl_id", "gene_name"]
# Drop NaN in gene_name
gene_info = gene_info.dropna(subset=["gene_name"])
# Set ensembl_id as index
gene_info = gene_info.set_index("gene_name")

adata_dict["Stereoseq-RCTD"] = adata_dict["Stereoseq-RCTD"][:, gene_info['ensembl_id'].tolist()]
adata_dict["Stereoseq-RCTD"].var_names = gene_info.index.tolist()

# Mapping
for k in adata_dict.keys():
    # If exist C_scANVI in obs, rename to celltype
    if "C_scANVI" in adata_dict[k].obs:
        adata_dict[k].obs["celltype"] = adata_dict[k].obs["C_scANVI"]
    # If k contains RCTD, replace(" ", "_").replace("/", "_").replace("-", "_")
    if "RCTD" in k:
        adata_dict[k].obs["celltype"] = adata_dict[k].obs["celltype"].str.replace(" ", "_").str.replace("/", "_").str.replace("-", "_")
        # Drop celltype is NaN
        adata_dict[k] = adata_dict[k][~adata_dict[k].obs["celltype"].isna(), :]
    # Mapping
    else:
        adata_dict[k].obs["celltype"] = adata_dict[k].obs["celltype"].map(celltype_map)
    # Astype category
    adata_dict[k].obs["celltype"] = adata_dict[k].obs["celltype"].astype("category")
    adata_dict[k].var_names_make_unique()

adata_dict["VisiumHD-RCTD"] = adata_dict["VisiumHD-RCTD"][:, adata_dict["VisiumHD-CellART"].var_names]
adata_dict["Stereoseq-RCTD"] = adata_dict["Stereoseq-RCTD"][:, adata_dict["Stereoseq-CellART"].var_names]

# Single cell reference
adata_sc = sc.read("/home/share/ychenlp/scrna_mouse_brain.h5ad")
adata_sc.obs["celltype"] = adata_sc.obs["subclass_label"].map(celltype_map)
# Only select those celltype in map
adata_sc = adata_sc[adata_sc.obs["celltype"].isin(celltype_map.values())]

ad_st_dict = {
    k: v.copy() for k, v in adata_dict.items()
}
corr_result = {

}

all_avg_df = {}

for method in ad_st_dict.keys():
    avg_df = pd.DataFrame(index=ad_st_dict[method].obs["celltype"].unique(), columns=ad_st_dict[method].var.index)
    ad_temp= ad_st_dict[method].copy()
    # Scale
    sc.pp.scale(ad_temp, max_value=10)
    for cell_type in ad_temp.obs["celltype"].unique():
        ad = ad_temp[ad_temp.obs["celltype"] == cell_type]
        avg_df.loc[cell_type] = ad.X.mean(axis=0)
    all_avg_df[method] = avg_df


import numpy as np
from scipy.stats import pearsonr

avg_sc = {}
for method in all_avg_df.keys():
    ad_temp = adata_sc.copy()
    ad_temp = ad_temp[:, all_avg_df[method].columns]
    # Filtered count
    sc.pp.filter_cells(ad_temp, min_counts=1)
    # Scale
    sc.pp.scale(ad_temp, max_value=10)
    avg_sc[method] = pd.DataFrame(index=ad_temp.obs["celltype"].unique(), columns=ad_temp.var.index)
    for cell_type in ad_temp.obs["celltype"].unique():
        ad = ad_temp[ad_temp.obs["celltype"] == cell_type]
        avg_sc[method].loc[cell_type] = ad.X.mean(axis=0)


all_corr_df = {}
for method in all_avg_df.keys():
    corr_df = pd.DataFrame(index=adata_sc.obs["celltype"].unique(), columns=all_avg_df[method].index)
    for cell_type in adata_sc.obs["celltype"].unique():
        for method_cell_type in all_avg_df[method].index:
            corr_df.loc[cell_type, method_cell_type] = pearsonr(all_avg_df[method].loc[method_cell_type], avg_sc[method].loc[cell_type])[0]
    all_corr_df[method] = corr_df
    # Convert to float
    all_corr_df[method] = all_corr_df[method].astype(float)

celltype_corr_df = pd.DataFrame(index=list(all_corr_df.keys()), columns=adata_sc.obs["celltype"].unique())
for cell_type in adata_sc.obs["celltype"].unique():
    # If not appear in some methods, skip
    for method in all_corr_df.keys():
        try:
            celltype_corr_df.loc[method, cell_type] = all_corr_df[method].loc[cell_type, cell_type]
        except:
            celltype_corr_df.loc[method, cell_type] = 0
# Drop NaN columns
celltype_corr_df = celltype_corr_df.dropna(axis=1)
/home/yhchenmath/anaconda3/envs/cellseg/lib/python3.9/site-packages/anndata/_core/anndata.py:1908: UserWarning: Variable names are not unique. To make them unique, call `.var_names_make_unique`.
  utils.warn_names_duplicates("var")
/tmp/ipykernel_3535210/3651906542.py:47: ImplicitModificationWarning: Trying to modify attribute `.obs` of view, initializing view as actual.
  adata_dict[k].obs["celltype"] = adata_dict[k].obs["celltype"].astype("category")
/home/yhchenmath/anaconda3/envs/cellseg/lib/python3.9/site-packages/anndata/_core/anndata.py:1908: UserWarning: Variable names are not unique. To make them unique, call `.var_names_make_unique`.
  utils.warn_names_duplicates("var")
/home/yhchenmath/anaconda3/envs/cellseg/lib/python3.9/site-packages/scanpy/preprocessing/_simple.py:165: ImplicitModificationWarning: Trying to modify attribute `.obs` of view, initializing view as actual.
  adata.obs["n_counts"] = number
/home/yhchenmath/anaconda3/envs/cellseg/lib/python3.9/site-packages/scanpy/preprocessing/_simple.py:165: ImplicitModificationWarning: Trying to modify attribute `.obs` of view, initializing view as actual.
  adata.obs["n_counts"] = number
/home/yhchenmath/anaconda3/envs/cellseg/lib/python3.9/site-packages/scanpy/preprocessing/_simple.py:165: ImplicitModificationWarning: Trying to modify attribute `.obs` of view, initializing view as actual.
  adata.obs["n_counts"] = number
/home/yhchenmath/anaconda3/envs/cellseg/lib/python3.9/site-packages/scanpy/preprocessing/_simple.py:165: ImplicitModificationWarning: Trying to modify attribute `.obs` of view, initializing view as actual.
  adata.obs["n_counts"] = number
/home/yhchenmath/anaconda3/envs/cellseg/lib/python3.9/site-packages/scanpy/preprocessing/_simple.py:165: ImplicitModificationWarning: Trying to modify attribute `.obs` of view, initializing view as actual.
  adata.obs["n_counts"] = number
/home/yhchenmath/anaconda3/envs/cellseg/lib/python3.9/site-packages/scanpy/preprocessing/_simple.py:165: ImplicitModificationWarning: Trying to modify attribute `.obs` of view, initializing view as actual.
  adata.obs["n_counts"] = number
/home/yhchenmath/anaconda3/envs/cellseg/lib/python3.9/site-packages/scanpy/preprocessing/_simple.py:165: ImplicitModificationWarning: Trying to modify attribute `.obs` of view, initializing view as actual.
  adata.obs["n_counts"] = number
/home/yhchenmath/anaconda3/envs/cellseg/lib/python3.9/site-packages/scanpy/preprocessing/_simple.py:165: ImplicitModificationWarning: Trying to modify attribute `.obs` of view, initializing view as actual.
  adata.obs["n_counts"] = number
/home/yhchenmath/anaconda3/envs/cellseg/lib/python3.9/site-packages/scanpy/preprocessing/_simple.py:165: ImplicitModificationWarning: Trying to modify attribute `.obs` of view, initializing view as actual.
  adata.obs["n_counts"] = number
/home/yhchenmath/anaconda3/envs/cellseg/lib/python3.9/site-packages/scanpy/preprocessing/_simple.py:165: ImplicitModificationWarning: Trying to modify attribute `.obs` of view, initializing view as actual.
  adata.obs["n_counts"] = number
/home/yhchenmath/anaconda3/envs/cellseg/lib/python3.9/site-packages/scanpy/preprocessing/_simple.py:165: ImplicitModificationWarning: Trying to modify attribute `.obs` of view, initializing view as actual.
  adata.obs["n_counts"] = number
/home/yhchenmath/anaconda3/envs/cellseg/lib/python3.9/site-packages/scanpy/preprocessing/_simple.py:165: ImplicitModificationWarning: Trying to modify attribute `.obs` of view, initializing view as actual.
  adata.obs["n_counts"] = number
[28]:
import matplotlib.patches as mpatches

method_colors = {
    "VisiumHD-CellART": "#A4869C",
    "VisiumHD-RCTD": "#DF8AA9",
    "VisiumHD-Bin2Cell": "#E0AF1F",
    "VisiumHD-StarDist": "#15A9AC",

    "Xenium-CellART": "#A4869C",
    "Xenium-10X": "#87A4BF",
    "Xenium-Baysor": "#E2B573",
    "Xenium-ProSeg": "#ADC6E9",

    "MERFISH-CellART": "#A4869C",
    "MERFISH-Vizgen": "#C7BEAF",

    "Stereoseq-CellART": "#A4869C",
    "Stereoseq-RCTD": "#DF6793"
}

df_result = pd.Series(celltype_corr_df.mean(axis=1), name="correlation")
# Split index into Dataset and Method
df_result = df_result.rename_axis("Dataset-Method").reset_index()
df_result[["Dataset", "Method"]] = df_result["Dataset-Method"].str.split("-", expand=True)

# Map colors
df_result["Color"] = df_result["Dataset-Method"].map(method_colors)

import pandas as pd
import matplotlib.pyplot as plt
import seaborn as sns


# Set up the subplots
fig, axes = plt.subplots(2, 2, figsize=(6, 7.5), constrained_layout=True)
axes = axes.flatten()

lim_upper = [0.65, 0.75, 0.65, 0.55]
lim_lower = [0.45, 0.55, 0.55, 0.48]

datasets = df_result["Dataset"].unique()
# Iterate through datasets and plot
for i, dataset in enumerate(datasets):
    ax = axes[i]
    subset = df_result[df_result["Dataset"] == dataset]

    # Create bar plot for each dataset
    sns.barplot(
        x="Method", y="correlation", data=subset,
        palette=subset.set_index("Method")["Color"].to_dict(),
        ax=ax,
        legend=True
    )

    # Customize each subplot
    ax.set_title(f"", fontsize=14)
    # ax.set_ylim(0.5, 0.75)
    ax.set_ylim(lim_lower[i], lim_upper[i])
    ax.tick_params(axis="x", rotation=45)

    # Axis labels and limits
    ax.set_ylabel("")
    ax.set_xlabel('')
    # ax.set(ylim=(0.18, 0.22))

    # Rotate x-tick labels
    ax.set_xticklabels(ax.get_xticklabels(), rotation=45, ha='right')

    # Remove grid
    ax.grid(False)

    # Customize spines (axis lines)
    ax.spines['left'].set_visible(True)
    ax.spines['bottom'].set_visible(True)
    ax.spines['left'].set_color('black')
    ax.spines['bottom'].set_color('black')
    ax.spines['left'].set_linewidth(1)
    ax.spines['bottom'].set_linewidth(1)
    ax.spines['right'].set_visible(False)
    ax.spines['top'].set_visible(False)

    # Add small outward ticks
    ax.tick_params(
        axis='both',
        which='major',
        direction='out',
        length=4,
        width=1,
        color='black',
        bottom=True, top=False, left=True, right=False
    )

    # Create a legend for the current subplot
    legend_handles = [
        mpatches.Patch(color=method_colors[f"{dataset}-{method}"], label=method)
        for method in subset["Method"]
    ]
    ax.legend(
        handles=legend_handles,
        loc='upper right',  # Adjust legend position
        frameon=False,  # Remove legend box frame
        fontsize=8
    )

    ax.set_xticks([])
    ax.tick_params(axis='y', labelsize=10)


# Turn off unused subplot axes if any
for j in range(i + 1, len(axes)):
    axes[j].axis("off")


# Add a global title
# fig.suptitle("Comparison of Correlations Within Each Dataset", fontsize=16)

# Show the plot
plt.show()
/tmp/ipykernel_3535210/336853864.py:48: FutureWarning:

Passing `palette` without assigning `hue` is deprecated and will be removed in v0.14.0. Assign the `x` variable to `hue` and set `legend=False` for the same effect.

  sns.barplot(
/tmp/ipykernel_3535210/336853864.py:67: UserWarning: FixedFormatter should only be used together with FixedLocator
  ax.set_xticklabels(ax.get_xticklabels(), rotation=45, ha='right')